
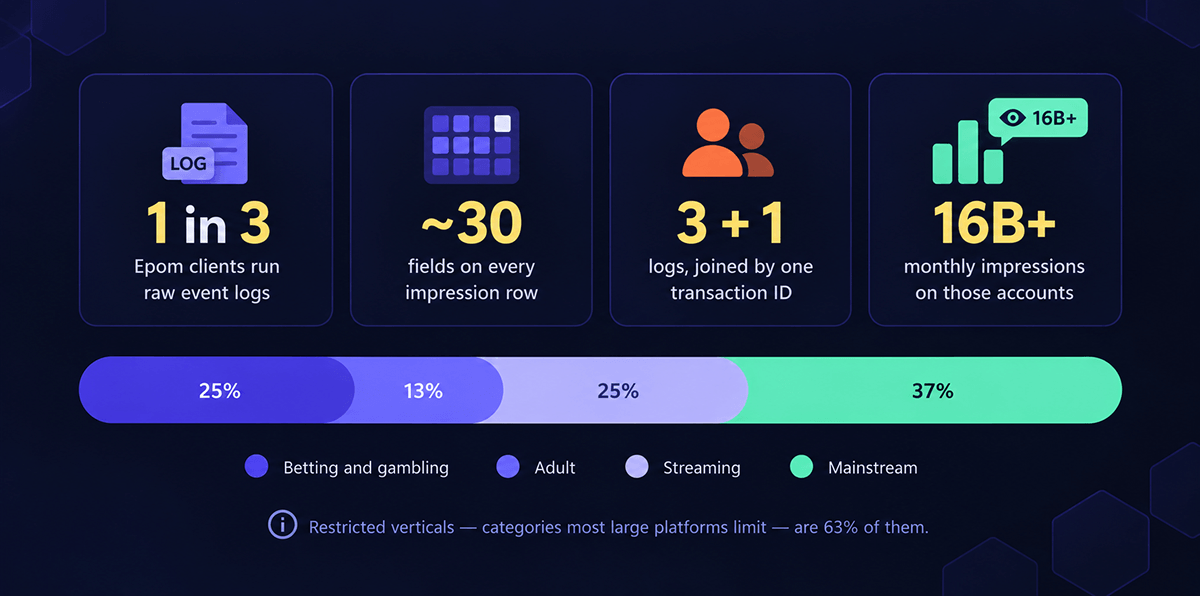
One in three Epom Ad Server clients already pulls raw event logs. Between them they serve over 16 billion impressions a month, and the two largest run 3.1 billion and 10 billion on their own.
They are not pulling log level data for better-looking reports. A question like which placement, on which browser, in which hour, in which market has no column in any ad server report. But it’s always recorded in logs that come with each impression, click, and conversion ever passed through the platform.
So these clients started requesting the impression log as CSV in addition to their detailed aggregated stats, one row per impression, and hand the file to a BI tool or an LLM. Then they ask where the money actually is.
Epom Ad Server exports log level data as raw CSV. Start a free trial and pull one from your own inventory and process them by BI and AI tools to enhance your business results.
TL;DR
- Log level data is advertising data recorded as one row per event — one impression, one click, one conversion — rather than a total grouped by campaign, day, or placement. It is also called event level data or raw logs.
- There are usually three: an impression log, a click log, and a conversion log. Most ad servers that offer them treat each as a separate report, exported as CSV.
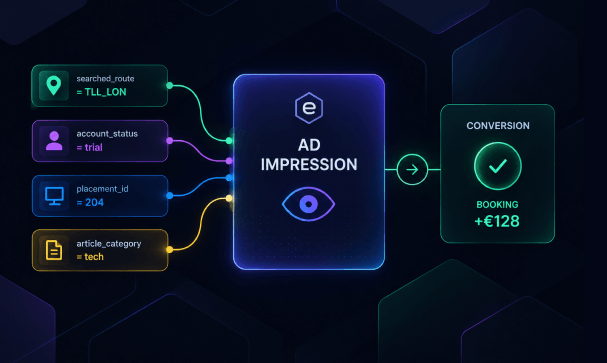
- A shared transaction ID runs through all three, so one user’s impression, click and conversion join into a funnel you can rebuild on your own rules.
- Each row carries dozens of attributes — timestamp, site, placement, campaign, banner, country, connection type, carrier, browser, OS, device model, IP, user agent, risk score, incognito flag. Conversion rows add action ID, attribution type and time to convert.
- Raw logs are usually stored for days, not months. Aggregated reports hold a long history. Plan a regular export if the event rows feed a warehouse — the window is set per account, not fixed by the product.
- Access is a paid tier almost everywhere. Google gates Data Transfer behind Ad Manager 360 plus a per-file fee. Epom allows exporting logs within their Advanced Analytics addon. Kevel give custom quotes to unlock detailed log data.
What Is Log Level Data?
Log level data in ad tech is advertising data recorded as one row per individual event — one impression, one click, one conversion. Not a number grouped by campaign, day, or placement.
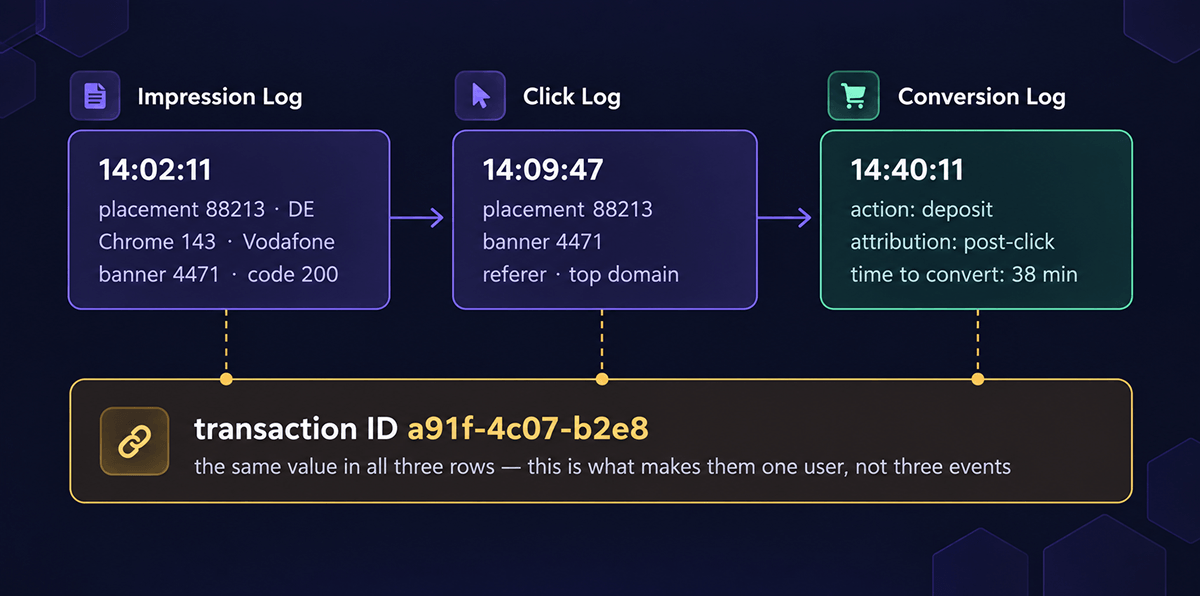
Example: an aggregated report says a placement served 900,000 impressions in Germany last week. A log row says that at 14:02:11 a specific IP running Chrome 143 saw banner 4471 on placement 88213. Response code 200.
The aggregate tells you the total was 900,000. The log tells you which 900,000 — which impressions, on which devices, in which hours, added up to that number.
Same data, two shapes
One placement, one day, one country. Switch between the report your dashboard shows you and the rows it was built from.
Rows returned
1
Fields per row
4
Question it answers
How many
Ask what is log data in a general computing context and you get the same idea: a timestamped record of something a server did. This is the advertising version.
The industry uses event level data as the same term, and you will see both in vendor documentation. Google calls its version Data Transfer, Kevel calls it Data Shipping, Epom calls it detailed metrics logs. All three mean one row per event.
What Are Ad Server Logs, Exactly?
Worth separating three things that all get called logs, because inside an ad server the word gets used three ways.
- Ad-serving event logs. One row per impression, click or conversion. This is what log-level data usually means, and what this article is about.
- Auction logs. Bid price, floor, clearing price, why a bid lost. This is what a supply-side platform or ad exchange works with. An ad server does not produce them, because it records what it served rather than what an exchange auctioned.
- Troubleshooting logs. Recorded per placement or banner by support to investigate a specific case. Internal only, used by the support team to identify errors.
Ask which one a vendor means before the demo. It saves everybody an hour.
Log level data — do you mean troubleshooting? Clients don’t use those. We record them ourselves, on a specific placement or banner, when we need to investigate a case. What clients use is the analytics — and which one depends on what they connected: standard, advanced, or the impression log.

Impression Log vs Click Log vs Conversion Log
Most ad servers split log level data into three files. The impression log records every ad served, the click log every click, and the conversion log every completed action. Each is a separate report you run independently, and most teams use two of the three.
- Impression log — one row per served impression. Raw impression logs are the largest of the three by a wide margin, and carry full device, network and inventory context. This is the file for traffic quality work, for reach and ad frequency, and for delivery patterns no grouped report exposes.
- Click log — one row per click. Same context fields, tied to the impression before it. Useful alone for click quality checks, and essential as the middle step in any attribution chain you build.
- Conversion log — one row per conversion. Carries three fields the others do not: action ID, the attribution type applied, and time to convert. For a network paying partners on deposits or signups, this file decides what you owe.
The three are linked by a transaction ID, present in every row of all three logs.
Without that key you have three unrelated datasets. With it you have a funnel.
What Data Is in a Raw Impression Log?
Log schemas are not standardised. A Google Ad Manager Data Transfer file and an Epom log row carry different fields. Check the list before assuming a query will port between platforms.
Here is Epom Ad Server's event level data schema. Around thirty attributes per row, grouped for readability. The event type is not a column — it is decided by which log you run.
| Group | Fields |
|---|---|
| Time | Exact timestamp |
| Supply and demand | Site, placement, zone, advertiser, campaign, banner, channel, custom parameter |
| Geography and network | Country, location, connection type, carrier, language |
| Device and client | Browser and version, OS and version, device vendor and model, web-app flag, full user agent |
| Quality signals | Risk score, risk level and category, fraud flag, incognito flag |
| Identity and request | Transaction ID, UUID, IP, response code |
| Conversions only | Action ID, attribution type, time to convert |
Three fields do more work than the rest.
Transaction ID joins the three logs, as above.
Risk score is a number on every event. That lets you set your own threshold rather than accepting the platform’s, and build invalid-traffic rules specific to your inventory.
Time to convert turns the conversion log into an attribution dataset. Knowing a deposit landed 40 minutes after the click rather than 40 hours is what lets you argue about attribution windows with evidence instead of convention.
Pro tip: whitelist your own identifiers as custom parameters before you start exporting. They travel with every event, which is what makes the log joinable to your CRM instead of a parallel set of numbers.
Who Uses Log Level Data, and How Common Is It?
Log level data has been a big-company feature. The named users in trade coverage are the ones you would expect — The Guardian, Nestlé, L'Oréal. The files run to terabytes, and reading them needed a data analyst on staff.
That barrier is analysis. A model can now read a CSV and tell you what is in it, which removes the one thing that kept event level data restricted to companies with a data team.
Roughly one in three Epom Ad Server clients has the raw-data layer switched on. Of the accounts where the vertical is on record, 63% are betting, gambling, adult or streaming.
That fits what those businesses need. They pay on conversions rather than impressions. They fight traffic quality daily. And their security teams will not accept conversion data leaving their infrastructure.
The size range is the surprising part. The smallest account running the logs serves under 100,000 impressions a month; the largest serves over 10 billion. Same feature, four orders of magnitude apart.
The small accounts are mostly specialist publishers — a software review platform, a finance site, a certification body — where inventory is small and every impression is worth understanding. Low volume makes event-level analysis more affordable, not less useful.
So the question is not whether you are big enough. It is whether you have a question your reports cannot answer. Here are the six that come up most often.
Log Level Data Use Cases: What Teams Build With Raw Logs and AI
Six event level data use cases come up repeatedly, ordered by what Epom clients actually do.
Ask an LLM What Actually Converts
Load the CSV into your AI model or a BI tool and ask it to find the combinations that perform. Placement plus browser plus hour plus market is four dimensions deep. No packaged report offers that, and no vendor could have guessed which four you need.
This is the use case that changed most recently. Two years ago it meant briefing an analyst and waiting a week. Now it is a file upload and a prompt.
People take it, feed it into their BI or into Claude, and look for patterns — what works where, and how well. Then scale the most profitable one based on this data.

Build Your Own Attribution and Payout Rules
This one matters most if you run an ad network. Your advertisers pay you per conversion, and you pay your publishers a share of that. Both sides of the deal depend on which conversions count.
You decide that yourself. When you create an action in Epom, you set the conversion window — one figure for click-through, another for view-through. Most networks pick something reasonable-sounding on day one and never revisit it.
If you set click-through to 24 hours and some of your traffic converts on day three, you do not bill for those conversions and your publishers do not get paid for them. Nothing in an aggregated report tells you it is happening.
The conversion log records how long each conversion actually took. One column, and it tells you whether the window you picked matches the traffic you have.
Catch GEO Mismatch and Proxy Traffic
A site reporting mostly Netherlands traffic while browser language and time zone say otherwise is inventory you are overpaying for. The log carries language, connection type, carrier and country on every row, so the mismatch becomes a query rather than a suspicion.
Risk score, risk category, IP and the incognito flag let you write invalid-traffic rules on top of the platform filter instead of accepting a filtered total.
Train CTR and Conversion Models
Prediction models want granular features — geo, device, time of day, placement, connection type. This is where adtech data analytics stops being a reporting exercise and becomes a modelling one.
Aggregates arrive pre-summarised, and summarising is the step you want the model to perform, not the step you want done for it.
This is also where the ad tech data lakehouse question comes up. Landing raw logs in BigQuery, Snowflake or Databricks alongside your first-party records is a standard big data adtech pattern, and the only part your ad server controls is whether it gives you a stable join key.
Build Audience Segments From Your Own Events
Joining impression and click events to your first-party records is how adtech audience data gets built without buying it. Custom parameters carry your identifiers into every row, so segments come out of your own delivery rather than a third-party graph.
Reconcile Events Against a Partner's Numbers
Match your events one by one against an advertiser’s or a third party’s records. Instead of two totals that disagree, you have a filterable list of the specific events in dispute. See the limits below before building a billing process on it.
How to Get Log Level Data From Epom Ad Server
You run a log report from the Analytics tab and export it as CSV, once your account manager has enabled the feature on your network.
Two rules confuse people in demos: why the logs need Advanced Analytics, and why the raw layer is sized differently from your reports. Both come from the same design.
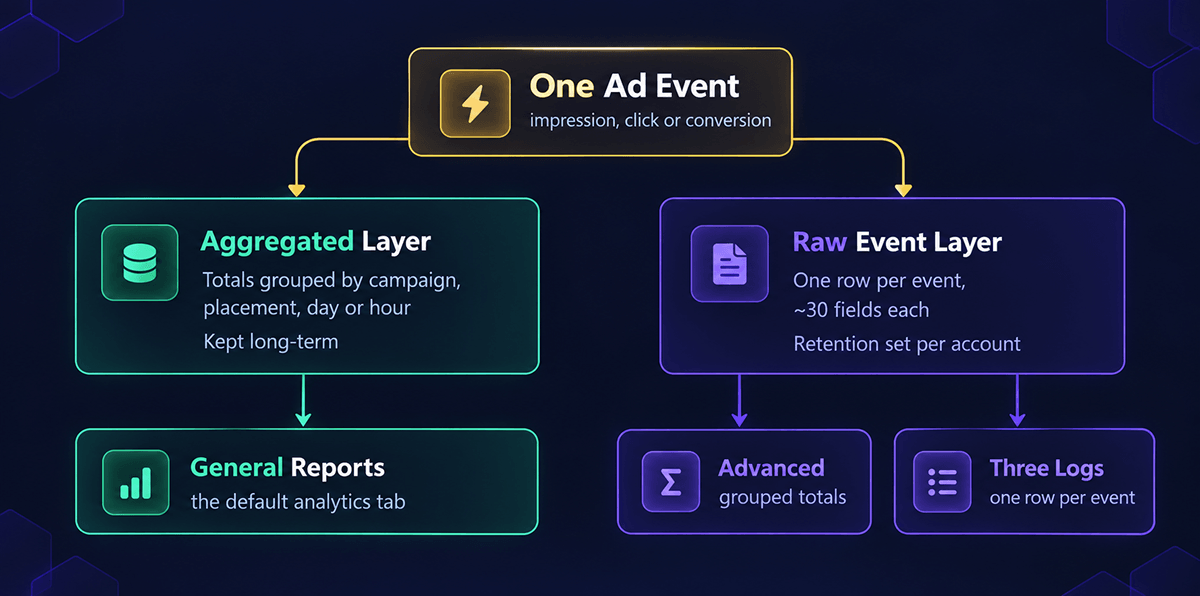
Epom keeps ad serving data in two parallel layers — aggregated totals and event level data — and every ad event is written to both.
The aggregated layer rolls events up by dimension into database tables — impressions, clicks and actions per hour or per day. The raw layer stores one row per event in a separate analytics cluster, partitioned by day, event type and server.
The log reports read the raw layer. So does Advanced Analytics, which computes its aggregates from those same event rows rather than from the database tables — which is why it can group by dimensions the standard report has never carried.
This is why the logs depend on Advanced Analytics. They are two views onto one dataset, not two products. No raw layer means neither exists.
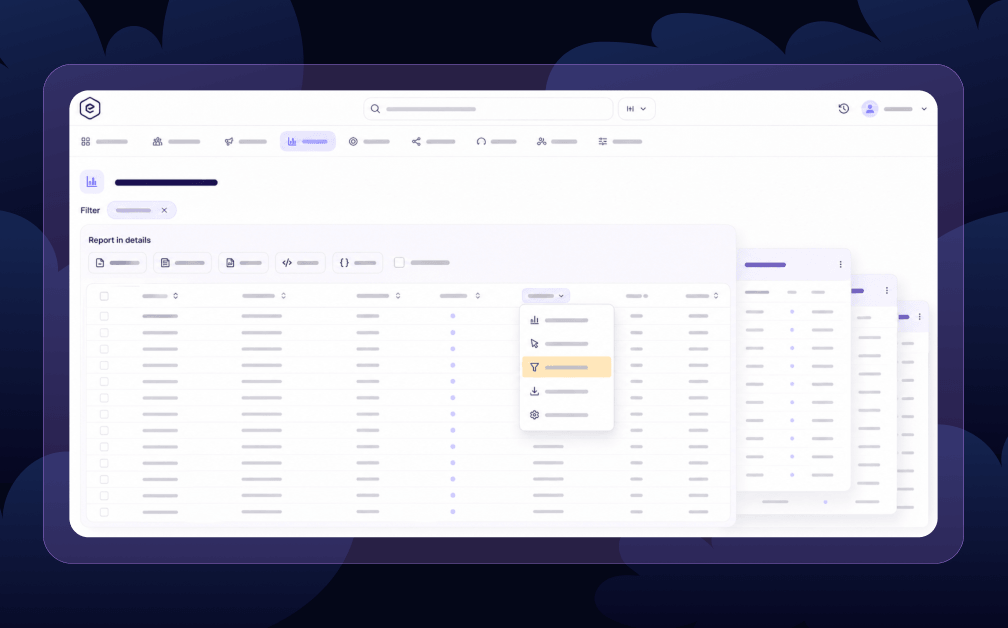
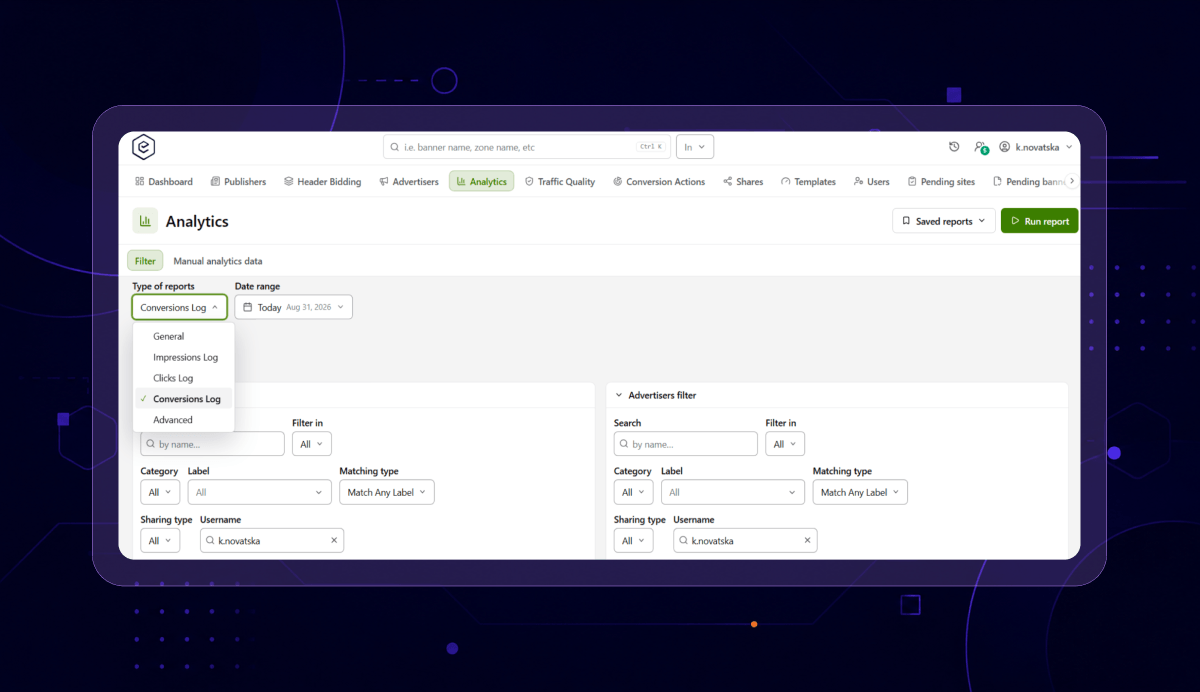
Running a report. Analytics tab, set Type of reports to Impressions Log, Clicks Log or Conversions Log. Reports run asynchronously — queued, results cached — because you are scanning events rather than reading pre-computed totals. Export is CSV, plus XLSX, JSON, PDF and HTML from the interface.
Permissions are deliberately strict. A log report needs view access to all inventory and all campaigns, on top of the report-type permission. Event-level rows expose both sides of the business, so partial access is not offered.
Switching it on. The logs are part of the Advanced Analytics package and are enabled per network by your account manager. In practice that means one conversation: which of the three logs you need, what retention you want, and where the files should go. Ask during a trial and you can test the export before committing.
Already know you need the event data log? Book a walkthrough and ask to see a live log export on your own inventory.
How Long Is Event Level Data Kept?
Two different answers, depending on which data you mean.
Standard reporting is kept long-term. Daily granularity is retained effectively indefinitely, so for normal reporting, history is not the constraint.
Raw retention is set per deployment. It ships with a short default, but there is no hard product cap — the real ceiling is storage, since more days means more event rows on disk.
Retention can also differ per event type. Keeping conversions long while impressions expire quickly is the common arrangement, and usually the right one: conversion rows are small and matter for months, impression rows are enormous and matter for days.
So the answer to "how long do I get" is: as long as you provision for, agreed per account. Anyone quoting a fixed number for raw logs is quoting a default.
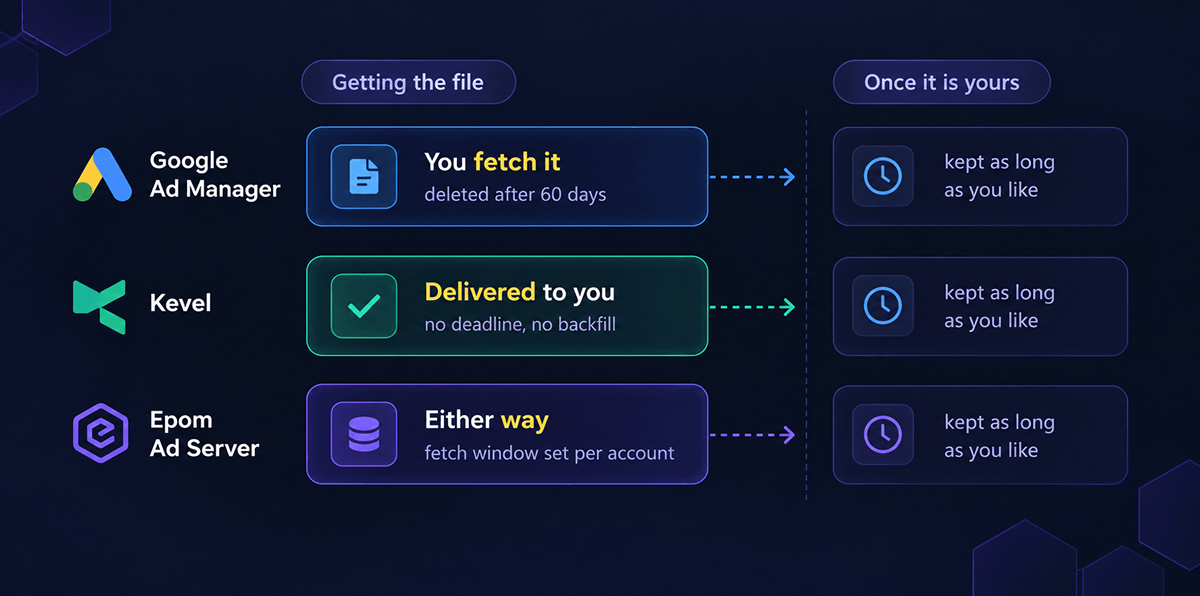
One thing worth understanding about every platform here. Google purges Data Transfer files from Ad Manager after 60 days and tells you to move them to storage you control. That 60 days is a pickup window, not a guarantee about your data. The same logic applies everywhere: once a file lands in your bucket, retention is your decision. What varies between vendors is how long you have to collect it.
AdTech Data Governance: What Leaves Your Infrastructure
A casino operator's security team will not approve a platform where conversion data exists somewhere they cannot see. Neither will an adult network. Data ownership is a compliance requirement rather than a preference, and no amount of reporting depth compensates for failing it.
Holding your own event level data changes the shape of that conversation in three ways.
- You hold the source of truth. Events land in your storage in a format you can read without the vendor. If the relationship ends, your history does not.
- Nothing has to be enriched elsewhere. The main way to prevent adtech data leakage is to stop moving data between systems that each keep a copy. One export into one warehouse you control is fewer copies than a chain of enrichment vendors.
- You set the rules on identifiers. Whitelisted custom parameters mean your IDs travel with the event and nobody else arrives with it.
On clean rooms. An adtech data clean room is the other answer to the same problem — two parties compute on combined data without either seeing the other’s rows. It solves matching against a partner. It does not solve owning your own delivery data, and it is a heavier build. If your question is "where does my conversion data live", raw logs are the direct answer.
Secure adtech data usage is mostly an access question rather than an encryption one, which is why Epom's log reports require view access to all inventory and all campaigns. There is no partial view of an event row.
Log Level Data vs Advanced Analytics
If you have looked at Epom's pricing, you will have seen Advanced Analytics listed as a separate module and wondered whether it is the same thing as the logs. It is not, and the two get confused in demos constantly.
Advanced Analytics returns grouped totals with extra dimensions. A log returns one row per event with no grouping.
| Advanced Analytics | Impression / Click / Conversion Log | |
|---|---|---|
| Each row is | A total, grouped by your dimensions | One event |
| Answers | How much, broken down finely | Which one |
| Extra dimensions | ~25 the standard report lacks | Every field is present |
| Dashboard widgets | Yes | No |
| Valid / invalid record filter | No | Yes |
| Report-level time zone selector | Yes — the only type with one | No |
| Dependency | Required for the logs to work | Requires Advanced Analytics |
Use Advanced Analytics when you want a total broken down by browser version, connection type or device model. Use a log when the individual events are the point.
Which Ad Platforms Offer Log-Level, Impression-by-Impression Transparency Instead of Aggregated Campaign Reports?
More than most buyers expect. The useful question is not who has it, but what tier it belongs to and whether they will take your vertical.
| Platform | Event-level product | Delivery | Tier |
|---|---|---|---|
| Google Ad Manager | Data Transfer — impression, click, activity | Hourly to cloud storage, purged after 60 days | Ad Manager 360 only, plus a fee per file type |
| Kevel | Data Shipping — nine log types including auction and request | Near-continuous to Snowflake, S3, BigQuery, Databricks | Custom, priced on request volume |
| Epom Ad Server | Impression, click and conversion logs; log-level API | UI export, API, or scheduled delivery to your storage | Paid add-on at any tier |
| Equativ | Log-level data alongside RTB reporting | — | Not published |
| Aniview | Log-level API, scheduled exports, audit trail | — | Not published |
| AdPlayer.Pro | Server-side logs | — | Not published |
| Magnite | REST report API, scheduled delivery to S3 | — | Not published |
Credit where it is due. Kevel's Data Shipping is the most detailed event-level product in this table — nine log types including auction, request and decision data an ad server does not normally expose, shipped near-continuously to seven destinations.
Two things the table does not show, and they decide most of these choices.
- Vertical acceptance. Google restricts gambling and bans most adult inventory. Kevel’s product is built around retail media and marketplaces. For an adult network or a gambling affiliate network, neither is in the consideration set at any price, which makes their feature depth academic.
- Price of entry. Google’s Data Transfer needs the 360 tier plus per-file fees. Kevel prices to request volume on a custom quote. Epom publishes its numbers: the entry plan is $250 a month, and Advanced Analytics is a $500 add-on. Whether that lands above or below a Kevel quote depends on your volume. The difference is that you can work it out before talking to anyone.
One clarification, since this question usually arrives phrased around SSPs. An ad server running an SSP module is the sell-side platform for your own inventory, so it answers the question directly.
Two Networks That Run on Raw Logs
Two short stories from Epom accounts using the raw layer.
The betting network that outgrew a legacy ad server
A European betting and media network arrived from Adition, an established European ad server, and now serves roughly 3.1 billion impressions a month on Epom. It runs the raw event data collection alongside standard reporting, which is what a network optimising on conversions rather than impressions needs once volume makes grouped reports too coarse to act on.
The adult publisher at ten billion a month
An adult streaming publisher serves over 10 billion impressions a month. At that volume, a one-percent traffic quality problem is a hundred million impressions, and no aggregated report will show you which hundred million.
Between them these two accounts illustrate the pattern honestly: raw logs are still mostly a large-operator tool. The smallest Epom account running the same reports serves under 100,000 impressions a month, though.
FAQ
Get the Raw Event Data, Not the Aggregated Summary
If the question you need answered is four dimensions deep, no grouped report will reach it — and no amount of AI helps when the only input you can give it is a total.
Epom Ad Server gives you event level data as impression, click and conversion logs joined by transaction ID, exported as CSV, JSON, HTMl or PDF, with nothing between you and your own numbers. We provide the infrastructure, so you could build your business on a steady foundation.
Ready to see what your own impressions look like one row at a time?
Bring your monthly volume and where you want the files to land. An ad ops specialist will tell you what a log export looks like at your scale. Talk to Epom about log access