Analytics & reporting overview
Two places to read your numbers — what the Dashboard and the report builder each answer, and why the report type you pick decides which engine runs.
Your numbers live in two places. Account → Dashboard is the standing view you glance at; Account → Analytics is where you ask a question and get a table back. Everything else in this section (report types, saved reports, schedules, exports) is something you do within Analytics, not another place to look.
This page is the map. Each surface has its own guide; the point here is knowing which one your question belongs to before you open it.
Who this is for
Everyone with an account — network managers, publishers and advertisers. All three get the Analytics page and a Dashboard tab. Where they differ is which side of the ledger their numbers come from (the column family a role may read), which is one setting with wide consequences — it also decides which Dashboard opens; Why two people can read different numbers below explains it, and Per-role notes says what each role ends up with.
Two places to read your numbers
| Surface | Where | Answers | What it is not |
|---|---|---|---|
| Dashboard | Account → Dashboard | ”How are we doing?” — a board of widgets you configure once and glance at (a role limited to publisher or advertiser columns gets a fixed KPI dashboard instead). See Dashboards. | Not ad-hoc. A widget is a saved report shape; changing what it shows means editing the widget. |
| Report builder | Account → Analytics → Filter | ”Why did X change?” — pick a report type, dates, group-by dimensions, metric columns and filters, then Run report. See Run a report. | Not a live feed. Each run is a snapshot taken when you pressed the button; the tab has a Refresh button to re-run it. |
Raw event logs — Impressions Log, Clicks Log, Conversions Log — are often described as a place of their own. They are not one. They are entries in the Type of reports dropdown on the same Filter tab, run with the same button, landing in the same kind of tab. What sets them apart is the data behind them — see Choosing a report type means choosing a data source.
Note: numbers surface in one more place that this section does not cover. Hovering an entity in the Publishers or Advertisers tree pops a card with that entity’s last-7-days figures, a seven-day impressions sparkline and a one-line snapshot of today. It comes from the same analytics service, is cached for 30 minutes, and uses the first metric family you may read — Base, then Advertiser, then Publisher.
Analytics is one page with a tab strip
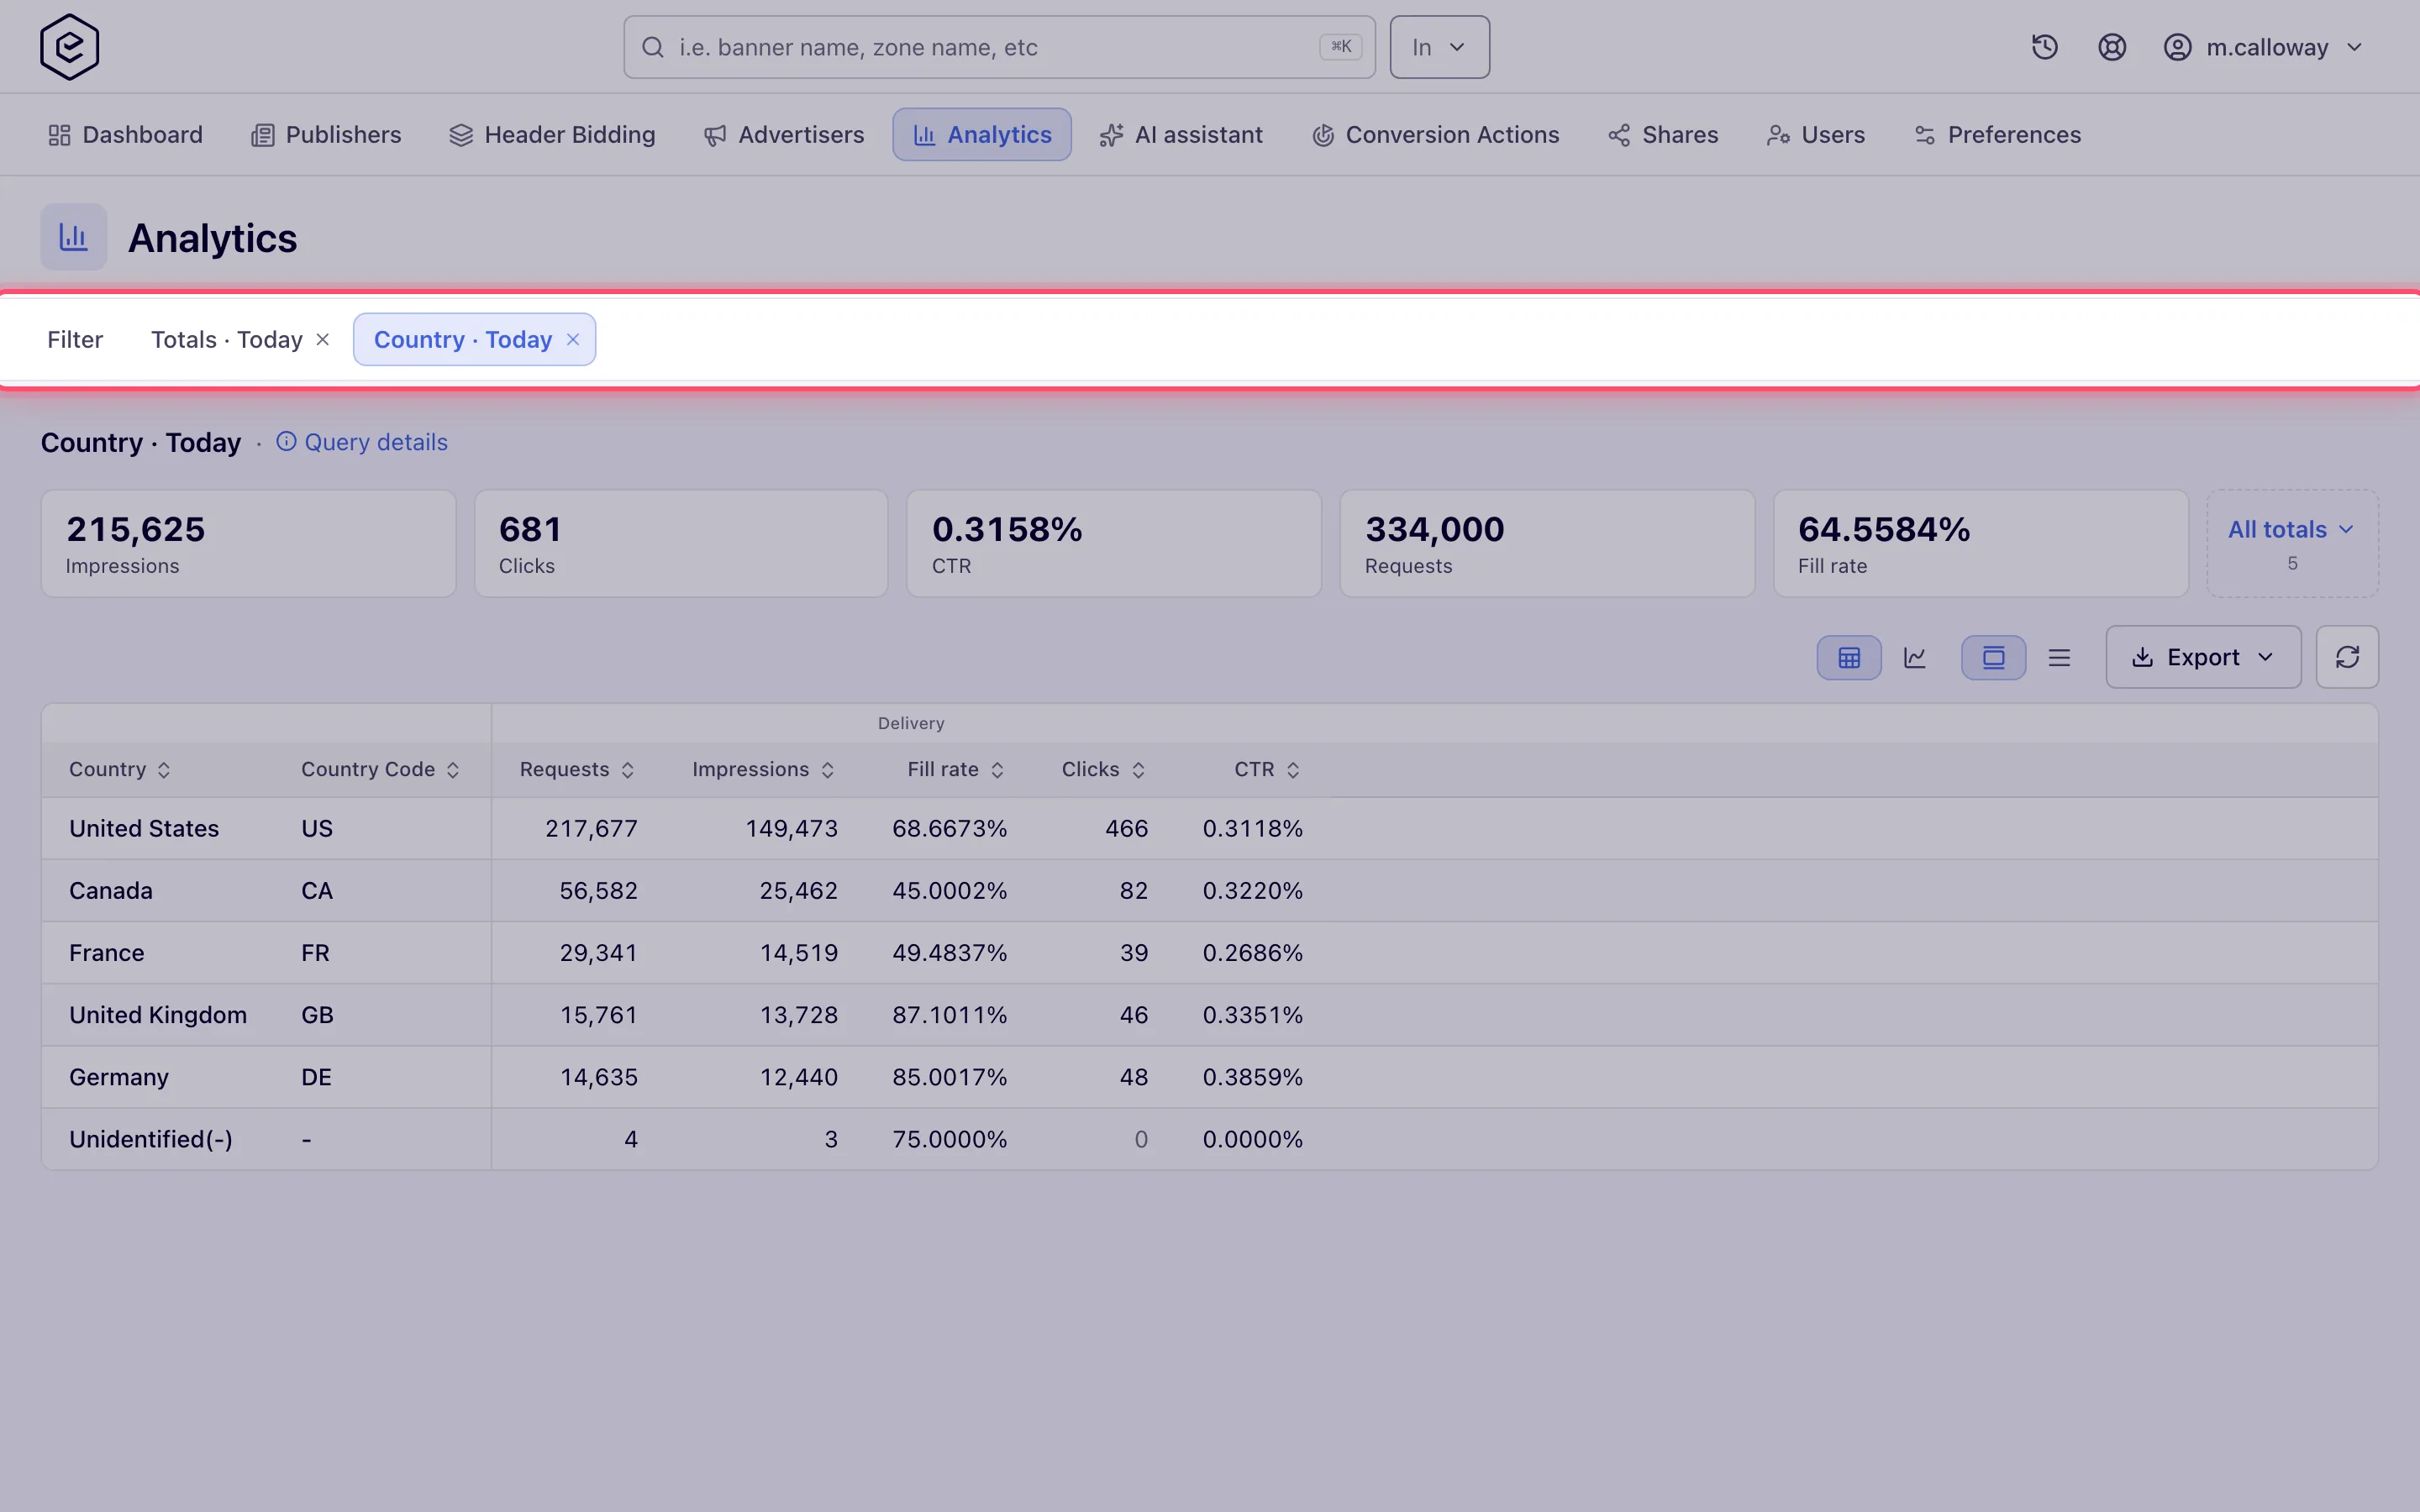
The Analytics page never navigates away from itself. It holds:
- Filter — the report form. It stays mounted, so your selections and tree ticks survive hopping to another tab and back.
- One closable tab per report you have run, named after what it shows rather than a number:
[subject] · [single entity, if you filtered to exactly one] · [period]. A report with no group-by isTotals, so the default run comes back as Totals · Today; a group-by readsSite › Placement(three or more levels collapse toFirst › … › Last); an Advanced or event-log report is named after its type (Advanced · Last 7 days, Impressions Log · Yesterday). Two reports that read alike get#Nappended to tell them apart.
Reports are held in your login session, not saved anywhere. Closing a tab discards that report on the server. So do signing out, letting the session expire, and the server restarting — the next time you open Analytics the strip is back to Filter alone. If you will want the same selection again, save it as a template rather than leaving the tab open.
Choosing a report type means choosing a data source
Type of reports is the first field on the Filter tab and the most consequential one. It does not switch between views of one dataset — it sends your request to different data, each with its own freshness and its own available dimensions:
| Type | Reads | How it runs |
|---|---|---|
| General (the default), Header Bidding, Targeting Cookie | Pre-aggregated hourly and daily statistics | Immediately — results render as soon as the query returns |
| Advanced | The full ad-request logs | As a background job, behind a wait N% progress bar |
| Impressions / Clicks / Conversions Log | The individual event logs | As a background job, same progress bar |
That is why two reports over the same dates can disagree and both be right, and why the last hour looks complete in General and thin in Advanced. How Epom computes your numbers is the mental model; Report types is the per-type detail — availability, freshness, which dimensions each one carries, and which permission gates it. Neither is duplicated here.
Note: General is the type the dropdown opens on. It has no feature switch of its own and is the one type every account with the Analytics tab can run.
A report is not read-only
Once a report is on screen it is also a place to act, which is the main thing that distinguishes it from a dashboard widget:
- Export it in five formats — CSV, XLSX, PDF, HTML or JSON — optionally compressed. Each format has its own row ceiling; a longer report is cut at it, and you get a notice when that happens. See Export reports.
- Save the selection as a reusable template, and schedule the template as a recurring email export to yourself plus extra recipients. See Save, reuse and schedule reports.
- Act on selected rows. Ticking rows reveals a toolbar that can set banners OFF, block a channel, or block or unblock a site or placement. Which buttons appear depends on both your permissions and how the report is grouped — Block site, for example, needs a report grouped by Site together with Campaign or Banner, because otherwise there is no row to act on.
Why two people can read different numbers
This is the single most common reason the product does not look the way a colleague described it, and it is worth understanding before you go hunting for a missing feature.
Most metrics exist three times over. impressions, publisher_impressions and
advertiser_impressions are three different columns that all render under the heading
Impressions. Which of the three you are reading is decided by your column family — Base,
Publisher or Advertiser (the permissions Analytics Report Columns Basic Analytics, … Publisher
Analytics and … Advertiser Analytics). The shipped Publisher role reads the Publisher family
only and the shipped Advertiser role the Advertiser family only: Base, the network’s own view, is
switched off for both, so each sees one matching preset chip (Publisher payout or Advertiser
charges). Your network administrator can change that. So two people can both be looking at a column called
Impressions, on the same date range, and be reading different numbers. When a figure does not
reconcile, check which family it came from before you check the data.
The column family also decides which Dashboard you get, which is why the Dashboard and a report can disagree at a glance. An account that may read Base gets the build-your-own widget board; an account that reads Publisher or Advertiser columns without Base gets the publisher or advertiser dashboard. So the shipped Publisher and Advertiser roles open their role dashboard, and a network manager opens the widget board once your network administrator has granted Base. See Dashboards.
A report type can be missing for reasons that have nothing to do with you. Advanced needs Advanced analytics to be set up for the network; Targeting Cookie needs cookie logging switched on; and the three raw event logs additionally require you to be able to see all inventory and all campaigns, so an account working only from shared entities never gets them. Report types has the full table.
Which page to read next
| Your question | Page |
|---|---|
| ”How are we doing this week?” | Dashboards — add a widget per metric and set its period once |
| ”Why did this campaign’s CTR drop?” | Run a report — General, grouped by the entity you suspect, then narrow with filters |
| ”Which report type should I use, and how fresh is it?” | Report types |
| ”Why don’t these two reports agree?” | How Epom computes your numbers, then Analytics discrepancies |
| ”What exactly happened on this placement, event by event?” | Report types → Impressions Log or Clicks Log |
| ”Send this to a client every Monday” | Save, reuse and schedule reports |
| ”Get this into a spreadsheet” | Export reports |
| ”The publisher’s, the advertiser’s and our numbers differ” | Analytics discrepancies for the cause |
| ”What does this column mean?” | Analytics metrics reference and Analytics dimensions reference |
Corner cases and gotchas
Corner case: report tabs are session state. Sign out, let the session expire or have the server restart, and every open report is gone — the strip shows only Filter next time. Nothing warns you first. Save a template if you plan to come back to the same selection.
Corner case: a report with no Group by and Time granularity None has nothing to break rows on, so it renders totals and no detail grid. That is the default state of the form, which is why a first run can look like it returned almost nothing. Add a group-by dimension or a granularity and the grid appears.
Corner case: dashboard widgets cannot be built on the raw log types. The widget dialog drops Impressions Log, Clicks Log and Conversions Log from its Type of reports list — they are per-event reports that run as background jobs, which is not a shape a widget can render. The dialog still lists Header Bidding and Targeting Cookie where you hold them, but a widget loads its data through the General report form, so only General and Advanced widgets return rows. See Dashboards.
Corner case: the sparkle Ask box, which fills the report form from a plain-language request, only renders on a network where Epom has switched Ask on, and only for a role that may run the General report (Analytics Report Type General). Otherwise there is no error and no disabled control — the input simply is not there. See Export reports and ask in plain language.
Per-role notes
- Network manager — the whole network; column families and report types follow what your network administrator granted the role.
- Publisher — the entities you own or are shared, in the Publisher (payout) family, with the publisher dashboard.
- Advertiser — the same in the Advertiser (charges) family, with the advertiser dashboard.
- Share-limited user — no raw event logs; on a Can View share the row-selection toolbar thins out, because its actions are writes.