Run a report
Build and run a report — report type, dates and time zone, time granularity, group-by dimensions, metric columns, filters, entity trees, and working with report tabs.
The report builder lives on Account → Analytics. The Filter tab is where you compose the question; every Run report opens the answer in its own closable tab, so you can keep several runs side by side and compare them.
Who this is for
Every account role. The builder is the same for a network manager, a publisher and an advertiser; what differs is which metric perspectives the Columns settings matrix offers, and that is all — see Per-role notes. Report types beyond General are switched on per role by your network administrator, so a network that has not asked for them runs everything here as a General report.
Prerequisites
- At least one entity with traffic in the window you ask for. Reports run happily over an empty window and return zeros.
Steps
-
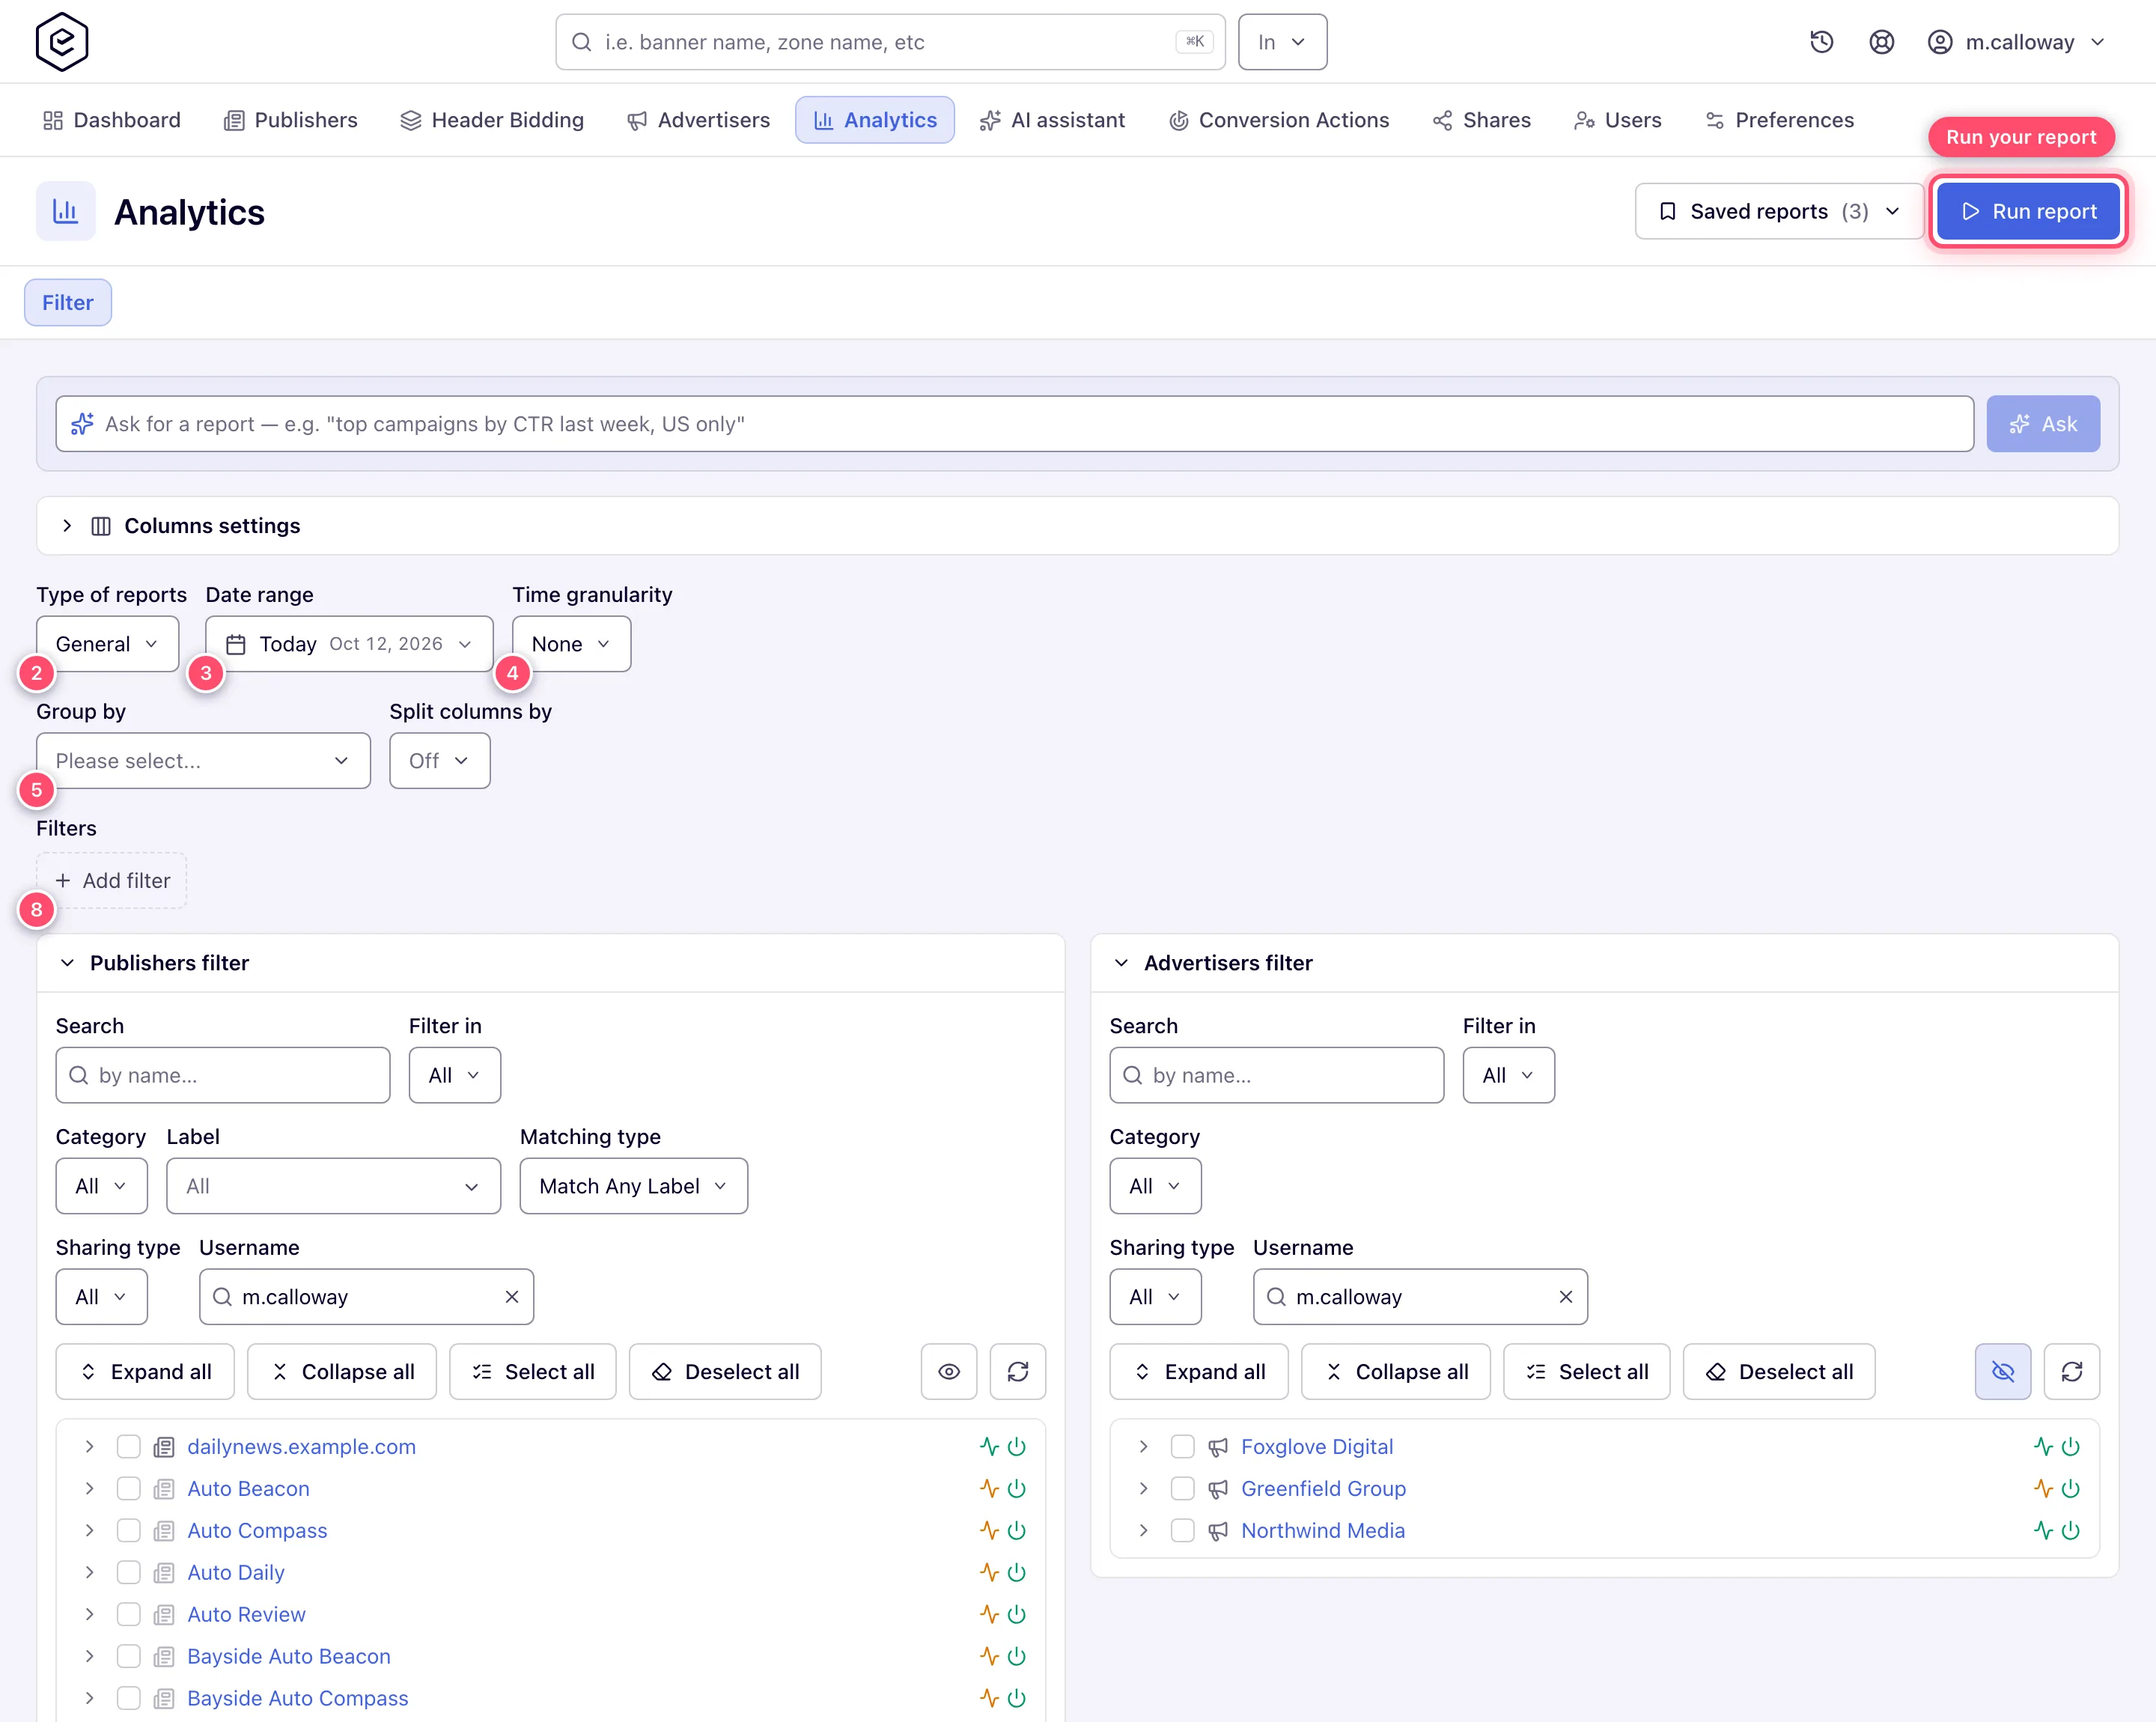
Go to Account → Analytics. You land on the Filter tab.
-
Pick the Type of reports. General is the default aggregate report and the one that needs no extra configuration; each of the others depends on its own data store or network flag, and changes which controls appear at all — see Report types. Changing the type resets the rest of the form: only your date range and your Valid/invalid choice survive.
-
Pick the Date range. The control is a calendar popover with the preset list down its side — Today, Yesterday, Current week, Last week, Last 2 weeks, Current month, Last 7 days, Last 30 days, Last month, Last 3 months, Last 6 months, Current year, Last year, and Custom range. Clicking two dates in the two-month calendar beside the list is what makes a Custom range, and it applies as soon as the second date lands. A preset stays relative: a saved “Last 7 days” still means the last seven days next month. A range your role may not use stays in the list, greyed out with a padlock, rather than disappearing; each range is its own Analytics Report Time Range … permission.
-
Set the Time granularity — the control that splits your rows over time. None (the default) means the whole window collapses into one figure per row; Day gives one row per day, and Hour, Week, Month, Year and 24 Hours the obvious equivalents. 24 Hours is an hour-of-day profile: every day in the window folded onto a single 24-hour clock. Which steps you can pick depends on the report type:
Report type Time granularity offered General None, Hour, Day, Week, Month, Year, 24 Hours Advanced None, Hour, Day, 24 Hours Header Bidding None, Hour, Day, Week, Month, Year Targeting Cookie None, Day, Week Impressions / Clicks / Conversions Log (no control — a log is a list of events) The list holds only the steps your role may use. If 24 Hours is missing, ask your network admin for Analytics Report Breakdown By 24 Hour.
-
Choose Group by — the dimensions that become the rows of your report. The list is grouped under the same headings the Add filter menu uses (Publishers, Advertisers, Geo & inventory, Device & browser, Traffic quality, Conversion actions, Attribution, Custom tracking, Labels and templates), and which entries appear depends on the report type. The order you tick them in is the order their columns appear in — Site then Placement reads as a drill-down, the other way round does not.
Note: there is no Date among the Group by dimensions. Bucketing by time is Time granularity (step 4), a separate control — and the two combine: Group by Country with granularity Day gives you one row per country per day.
-
Optionally choose Split columns by — what runs across the columns instead of down the rows. Group by shapes the rows; this shapes the columns. It is a multi-select, and the list arrives in four groups:
Group Options Your funnels each conversion funnel you have saved, by name — see Funnels Conversion actions Conversion action (one column per action), VAST quartiles, Viewability, Video player interactions (the same per-action split, with that family’s actions picked and ordered for you) Attribution Attribution type (the post-click and post-view arms), Expired windows (conversions that arrived after their action’s window had closed, and were never credited) Other dimension Custom parameter — the Parameter / Value / Count trio; takes the columns alone, and only once Action is in your Group by Every one of these splits divides conversions, so picking one ticks a conversion metric for you if your columns had none. An option that cannot apply right now stays in the list, greyed, with the reason underneath — “Group by conversion action first” on Custom parameter, for example.
-
Tick the metric columns in the Columns settings section at the top of the form. It is a matrix: one row per metric, one tick-column per perspective (Base, Advertiser, Publisher). Tick a row label to take every perspective of that metric at once, tick a perspective heading to take every metric in it. The rows sit in the same families the result grid bands its columns by — Delivery, Conversions, Attribution, Expired windows, Custom parameters, Money, Uniques, and Other last — so the section you pick a metric from is the band it arrives under.
Preset chips (Traffic, Revenue, Conversions, Advertiser charges, Publisher payout) pick a whole set at once; touching any checkbox flips the chips to Custom. A chip is hidden when the perspective it needs is not yours, and Header Bidding shows no chips at all. Show IDs adds the entity-ID columns. A line under the matrix reads “Report will have N columns” and lists them as chips in the order they will appear. At least one metric must stay ticked — emptying the matrix raises “At least one option must be selected” and the change is refused. Your picks stick per report type: this browser remembers them, and every run also saves them to your account.
-
Add value Filters. Active filters show as chips carrying their values; everything else hides behind Add filter, which opens a searchable menu grouped into Geo & inventory, Device & browser, Traffic quality, Conversion actions, Custom tracking and Labels and templates. Which groups and entries appear depends on the report type — a General report offers Country, Placement Type, Placement Size, OpenRTB Publisher ID, Conversion Action Filter, Channel, Placement Label, Banner Label, Banner Template and ISCI / Ad-ID — each only if your role holds its permission. Advanced adds the whole device, browser and traffic-quality range but drops the label, template and ISCI / Ad-ID filters; Header Bidding offers only Country and Fill Source. Click a chip to re-open its editor (with Clear and Done), or its ✕ to remove it. An empty filter means “All” — it is not sent to the server at all.
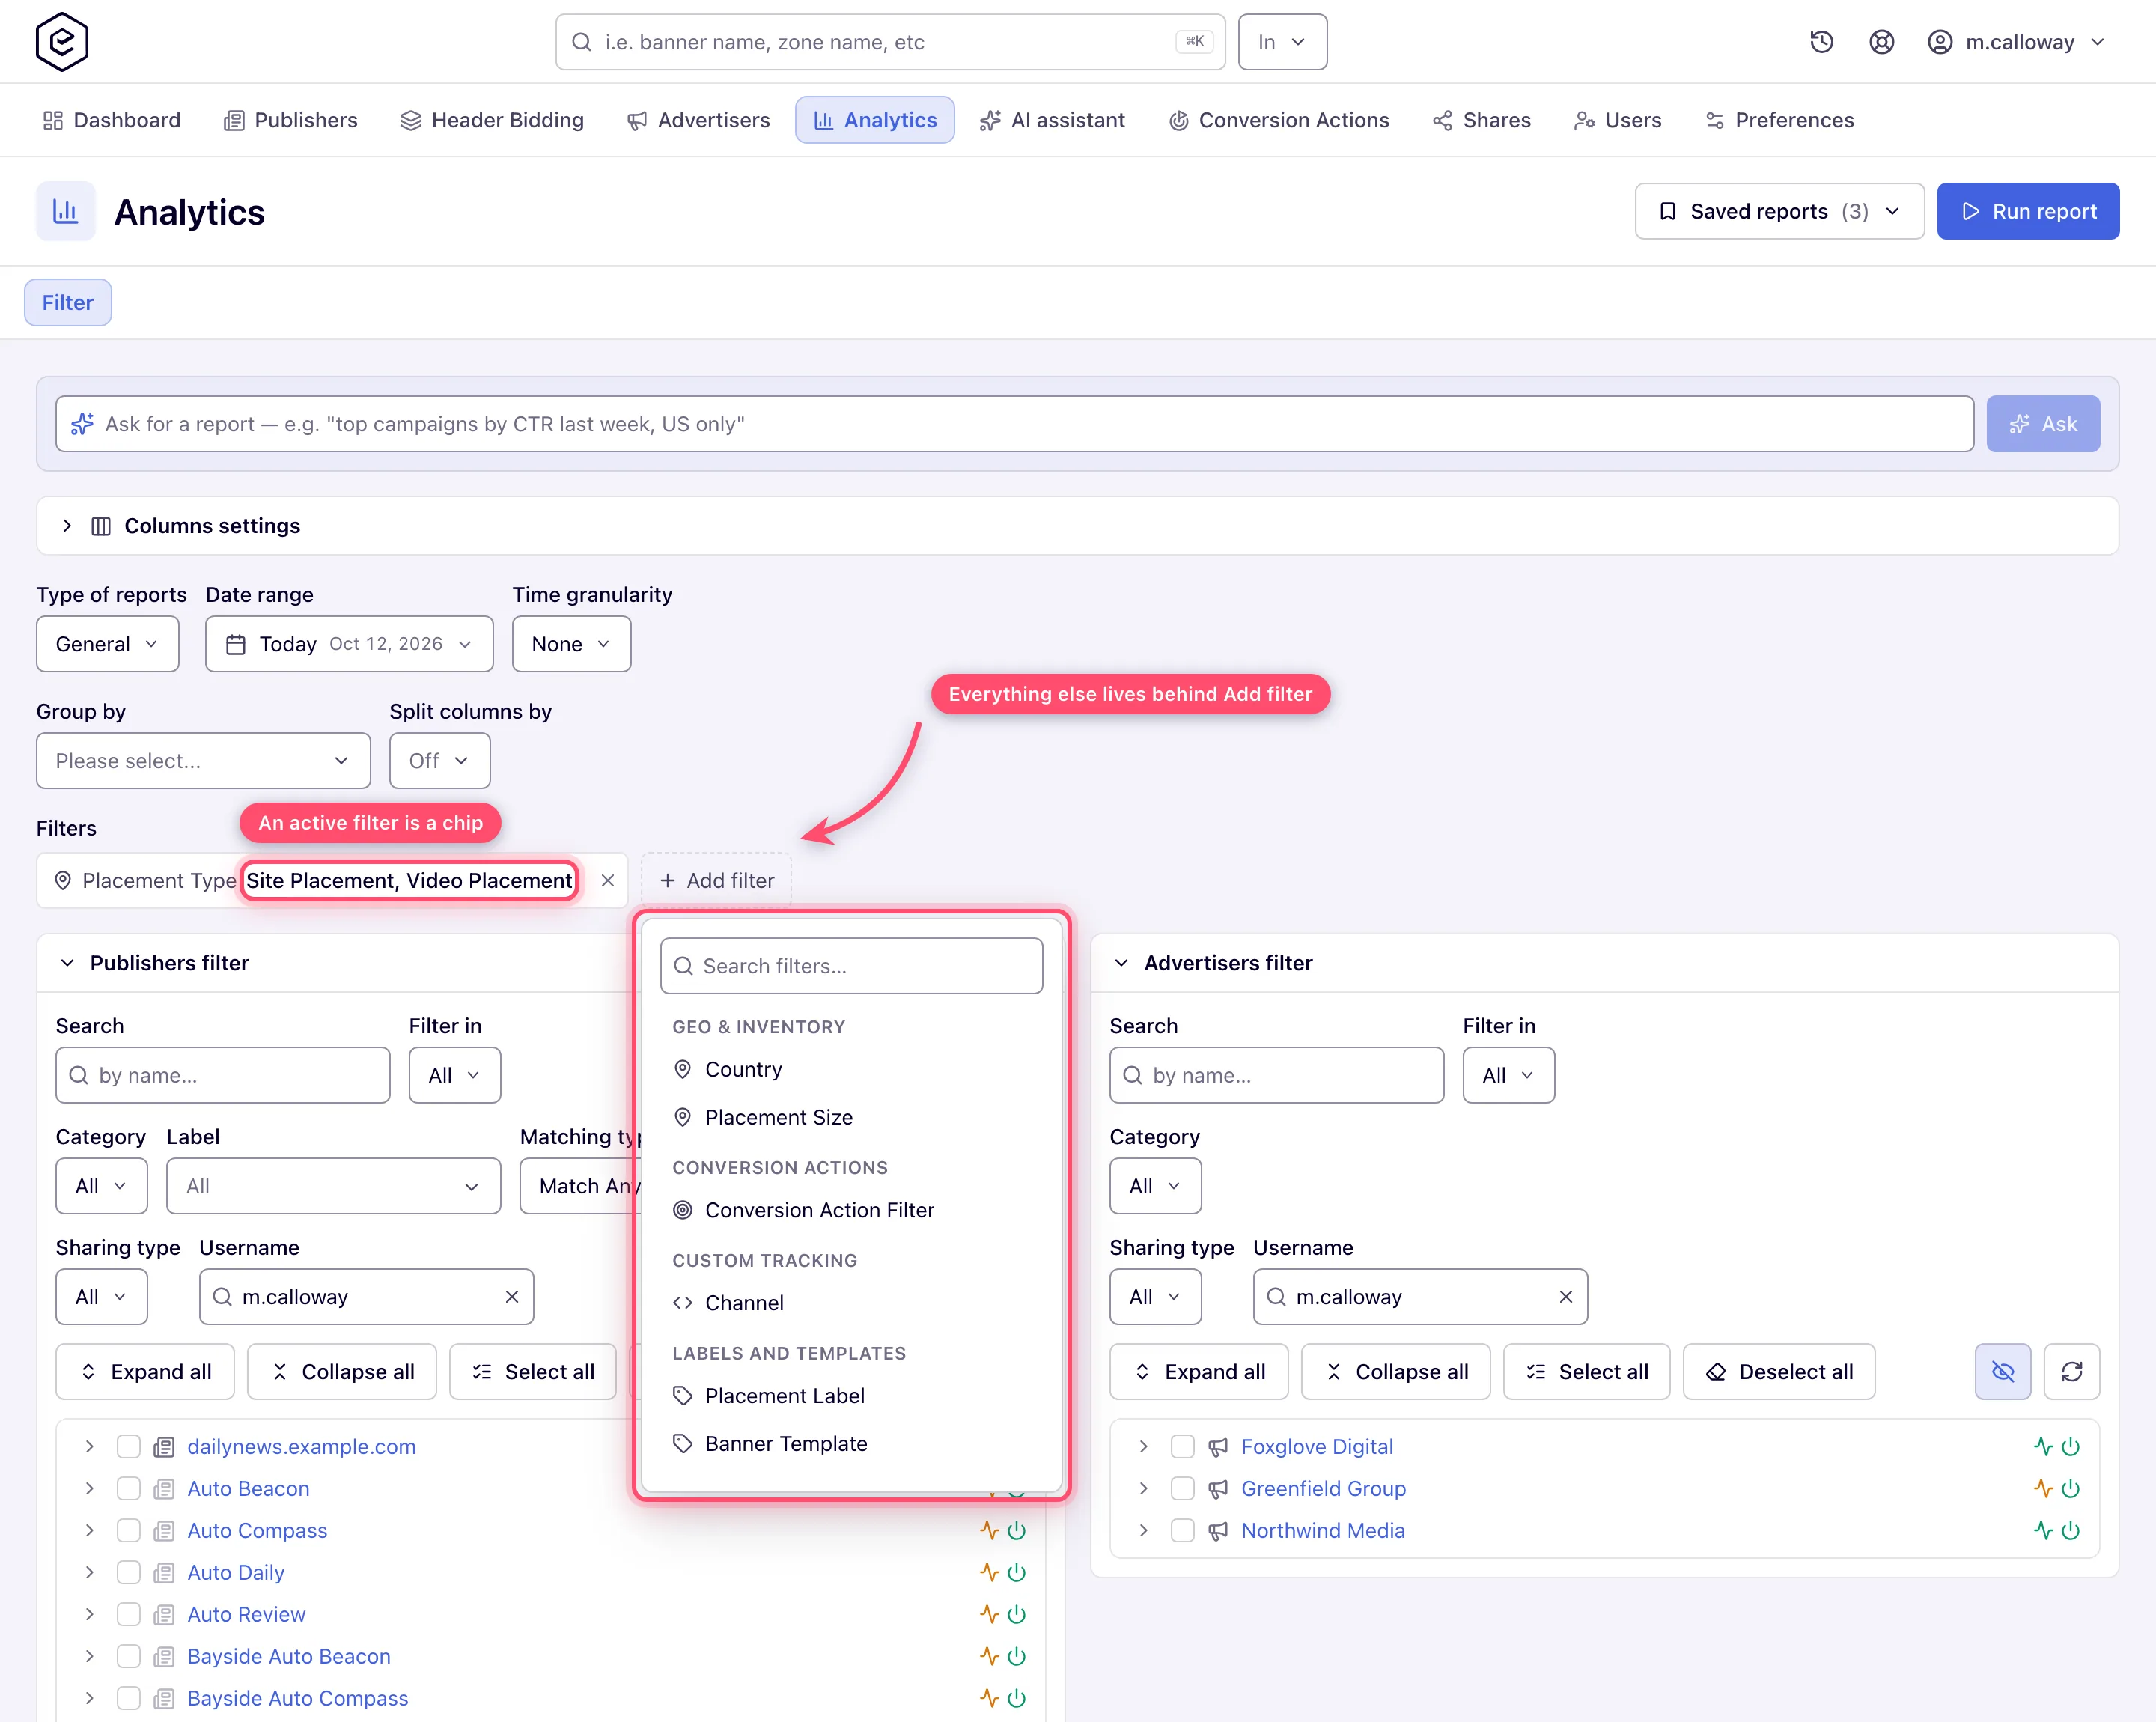
- A filter you open from the menu keeps its chip on the bar even before you give it a value, so you can swap one value for another without the chip vanishing under you. The ✕ is what removes it.
- Picking Placement Label or Banner Label values makes a Filter all labels checkbox appear under the bar: checked, an entity must carry every label you selected; unchecked, any one of them is enough.
- Conversion action custom parameter (a Parameter name / Parameter value pair) is offered only while Action is in your Group by and your role may use custom parameters.
-
Narrow to specific entities in the Publishers filter and Advertisers filter check-trees — sites, zones and placements on one side; advertisers, campaigns and banners on the other.
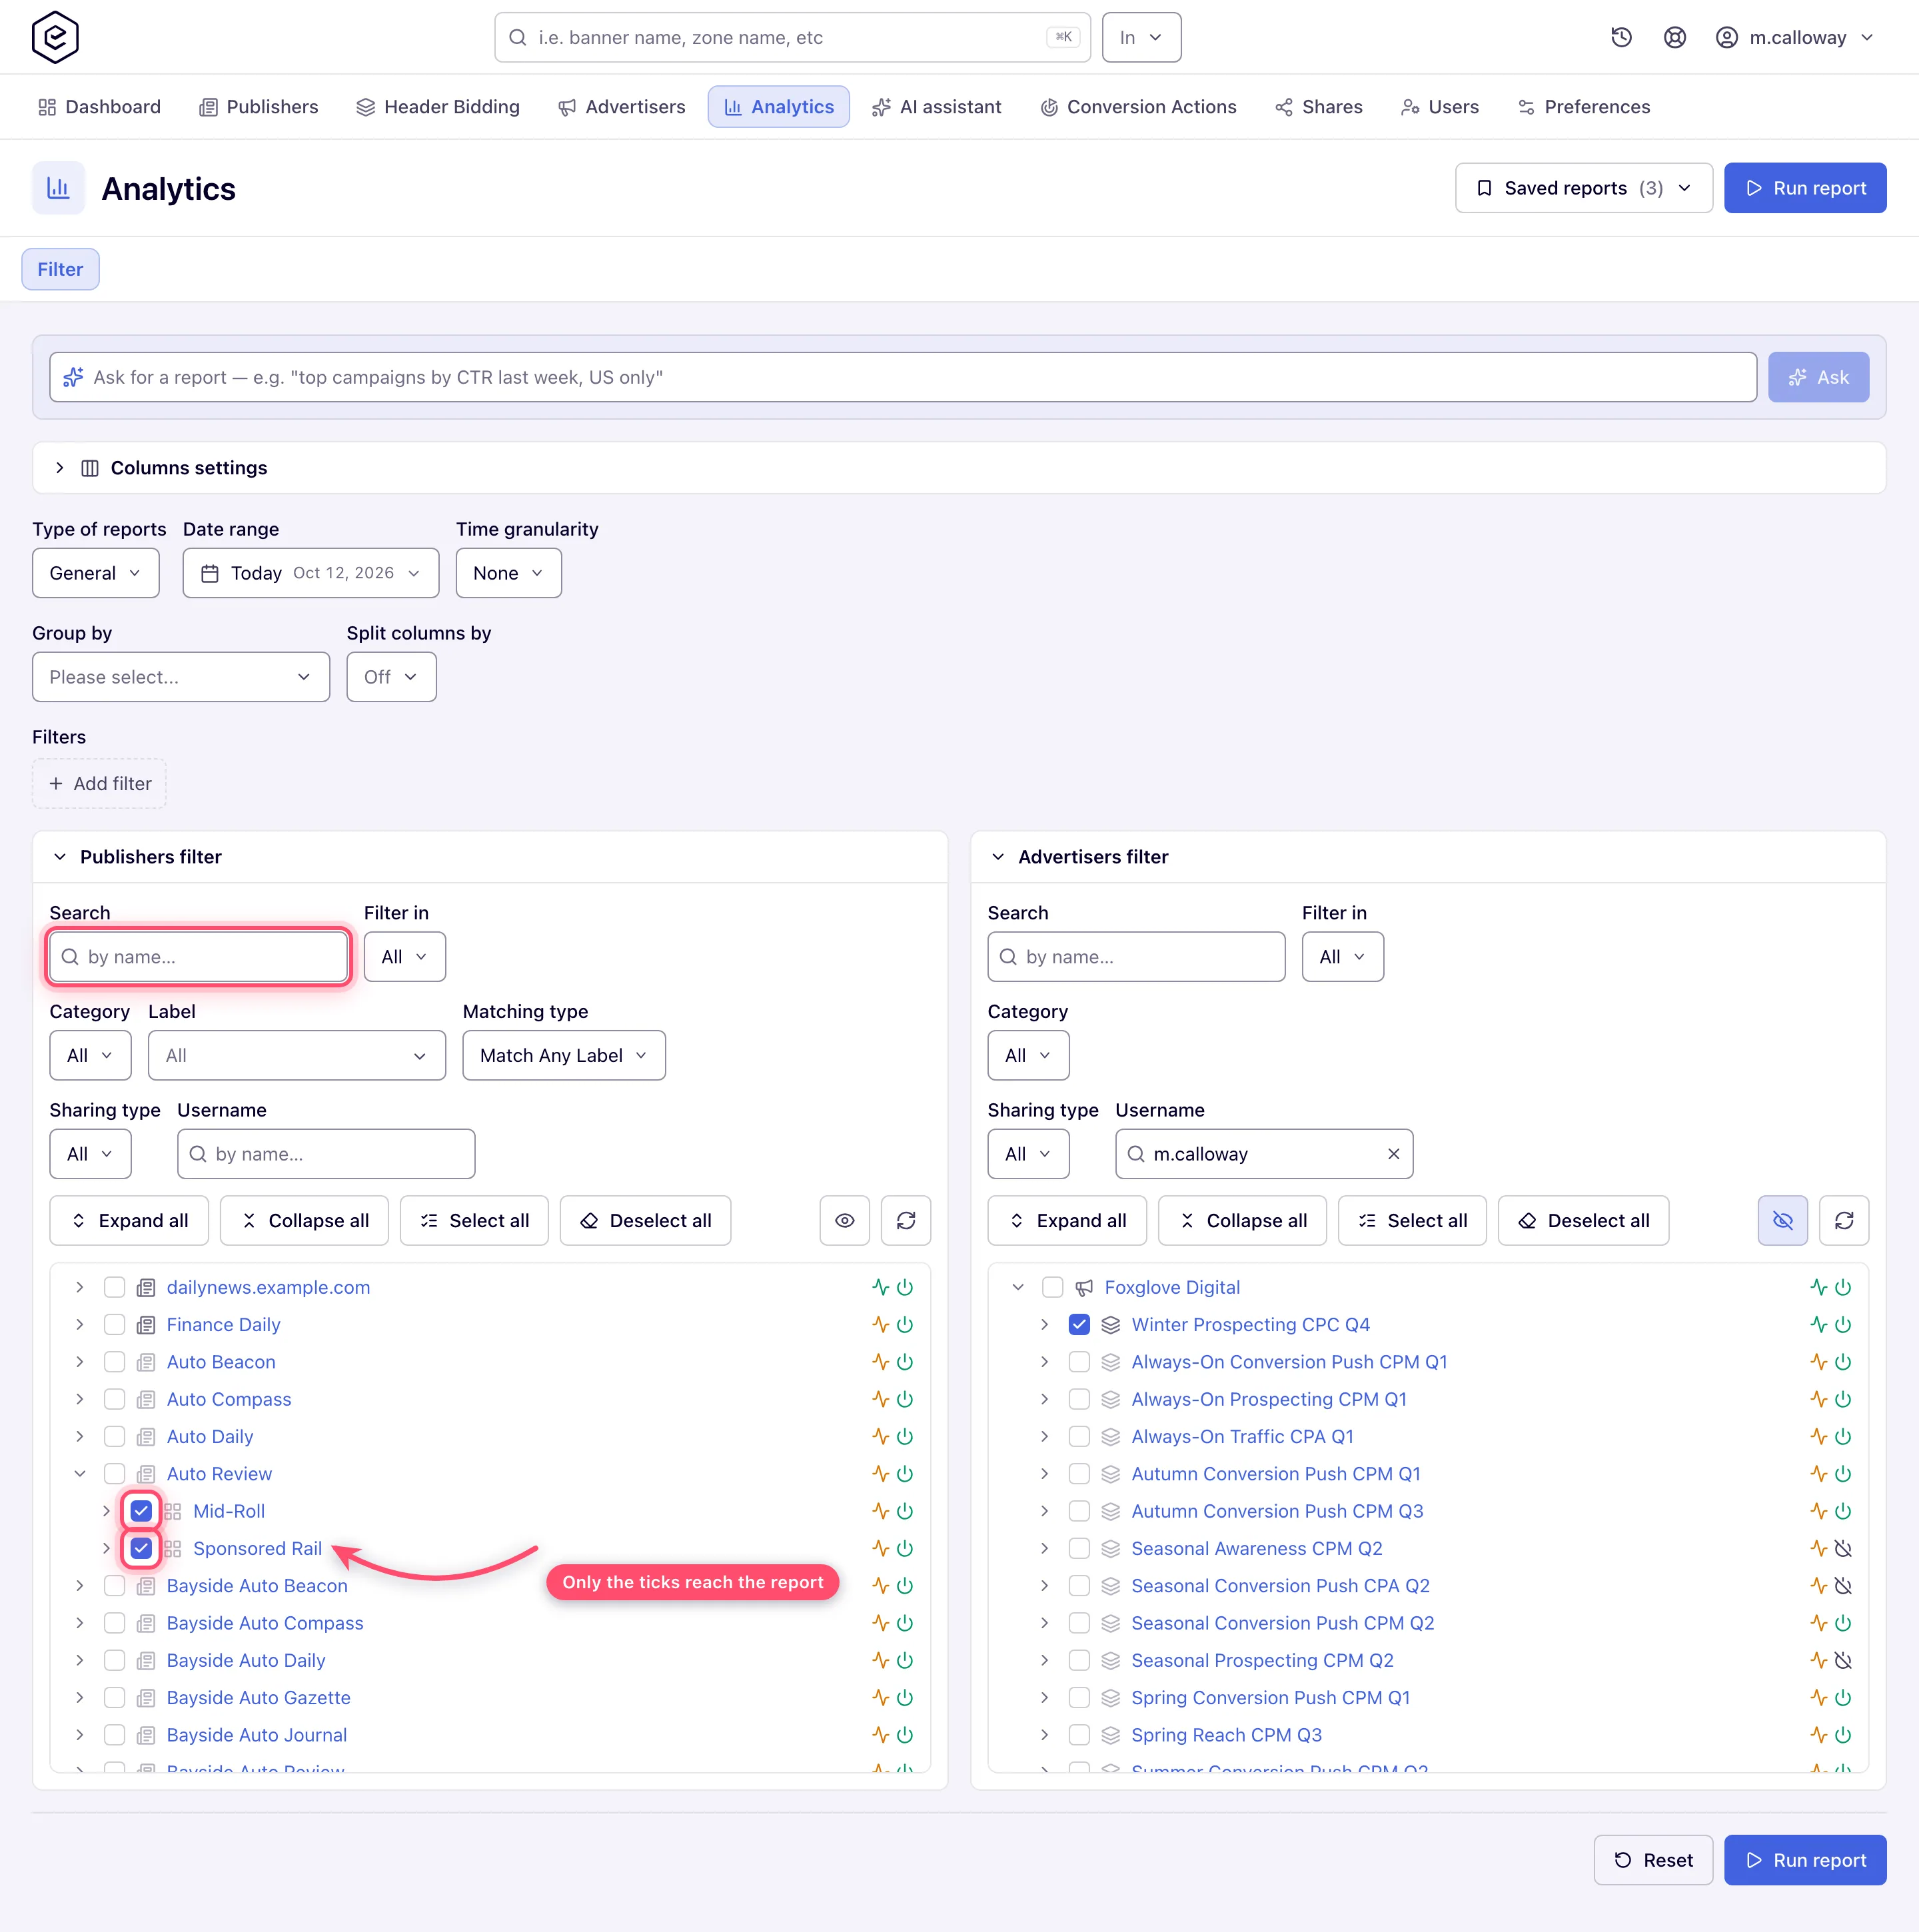
Only the checkboxes reach the report. Everything else in each panel is a way to find the entity you want to tick:
Control What it does Search narrows the tree to nodes whose name matches Filter in limits the tree to one level — Sites / Zones / Placements, or Advertisers / Campaigns / Banners Category limits it to one publisher or advertiser category — shown only if your role uses categories Label + Matching type limits it to entities carrying the chosen labels; Match Any Label (the default) or Match All Labels — shown only if your role uses labels Sharing type + Username limits it to what a given user owns (Is owner) or has been shared (Can edit / Can view) Expand all / Collapse all open or close every loaded level Select all / Deselect all tick every root node, or clear the whole selection eye button (top right) Hide inactive — pressed by default, so the trees start with active entities only Ticking nothing means every entity, not none: the report’s Query details will read Site(s): All, Advertiser(s): All, and so on. Tick a parent and only that parent’s traffic is counted, at whatever depth your Group by asks for.
A Header Bidding report shows the Publishers tree alone: it counts auction rounds on a publisher’s page and has no demand dimension to filter on.
If your account is set to the Grids view, each panel is instead a flat list of the entities you sent here with Add to report on the Publishers and Advertisers grids; the checkboxes and the empty-means-all rule work the same way.
-
Click Run report — in the page header, or the copy at the bottom of the form. A new tab opens next to Filter, named after the report rather than numbered: Totals · Today, Country · Last 7 days, Impressions Log · Yesterday. Advanced and the three event logs run as background jobs and show a wait N% progress bar first.
-
Read the report.
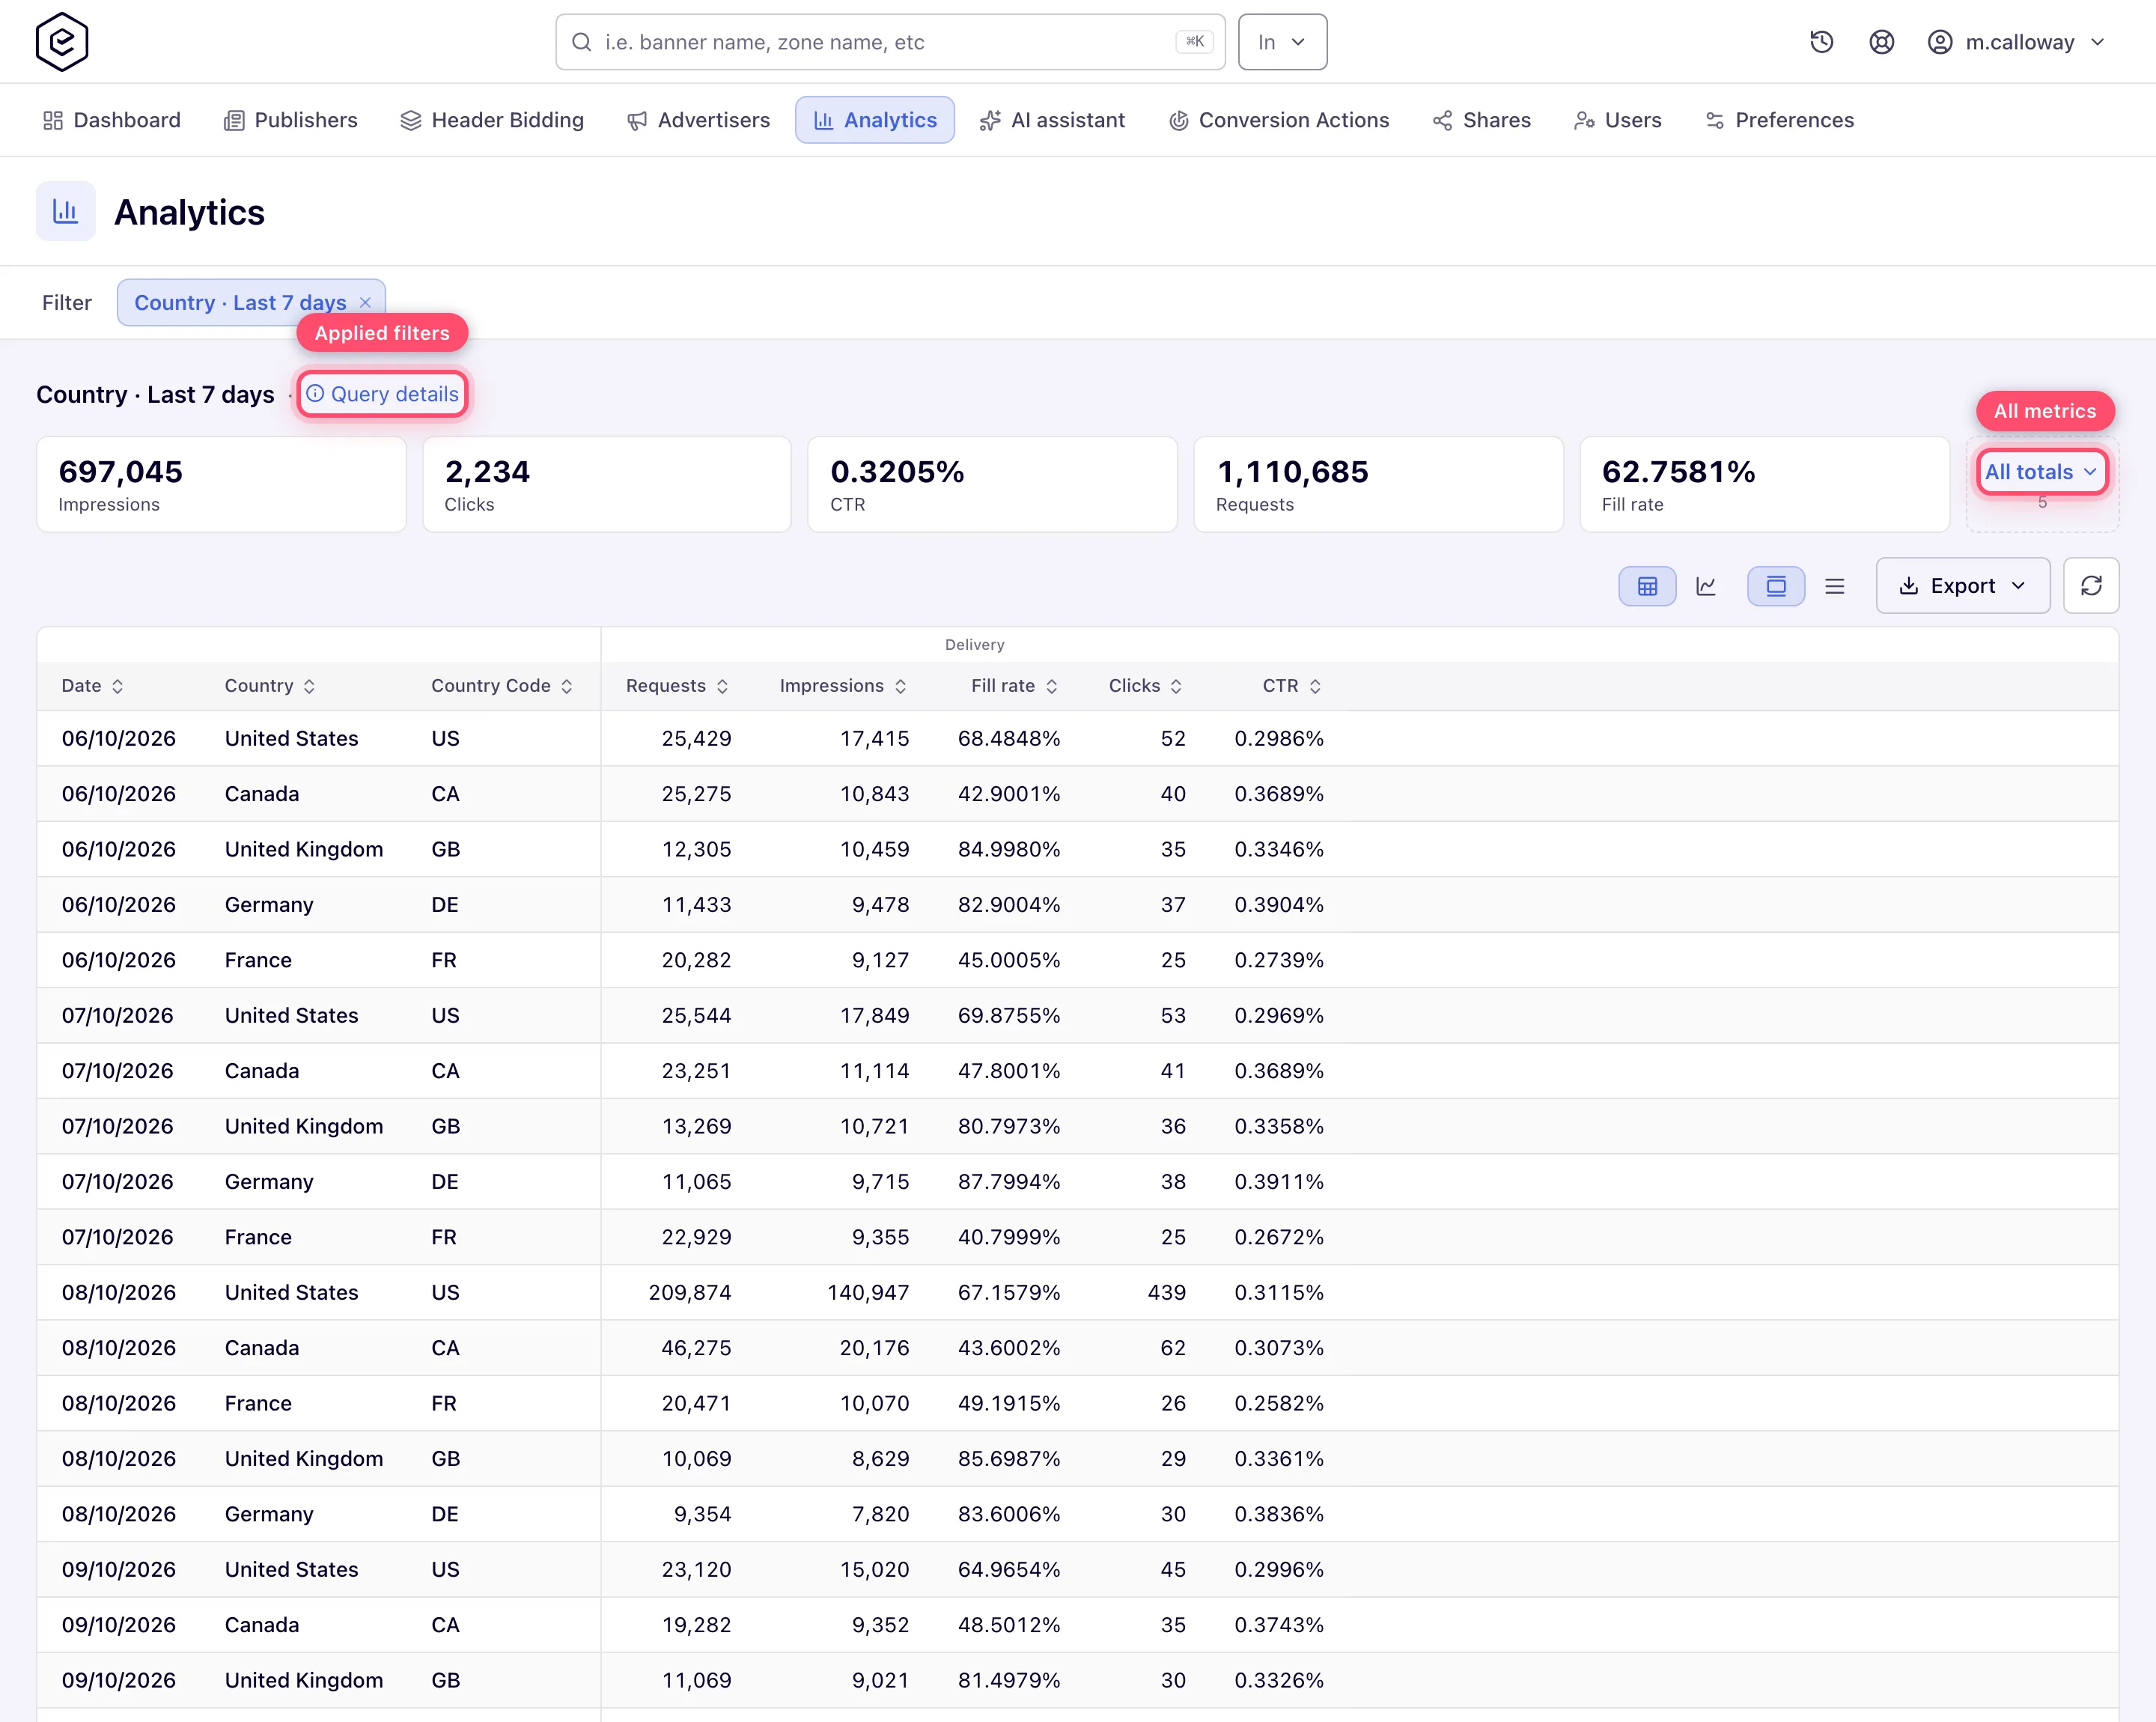
- The title line carries the report’s subject and period, plus a Query details link that opens the exact question that was asked: dates, time granularity, group-by, time zone and every entity filter.
- KPI tiles — the summary totals, one tile per metric, as many as fit the width. The star on a tile pins it so it always ranks first; All totals (N) expands the full metric × perspective matrix underneath.
- The toolbar on the right holds the grid / graph switch (only offered once the report has a Group by or a time granularity — a totals-only report has nothing to plot), the comfortable / compact row-density pair, Export (see Exports), Columns, and Refresh.
- The detail grid is banded by metric family, in the same order Columns settings listed them. Columns hides a whole band at a time — that is a display toggle local to this tab, not a re-query. Click a header to sort: first click ascending, second descending, third back to unsorted. 50 rows per page.
-
To refine, click back to the Filter tab. The form keeps everything you set — including the tree selections — so you can adjust one thing and run again. Each run is a new tab; close one with its ✕.
Jumping in from an entity
Hover any entity in the Advertisers or Publishers tree and choose Analytics on its hover card. The Filter tab opens pre-filled with that single entity over the last 7 days — review it and press Run report.
Working with report tabs
- Tabs are named by the report, and a second run that reads the same gets the technical index appended: Totals · Today #1, Totals · Today #2. Close one and the survivor drops its suffix.
- There is no limit on how many can be open at once.
- The forms live in your server session, so a browser refresh restores every tab and the one you
were on — the
?reports=[1,2]&tab=2in the address bar is that state, andtabis the report’s session index, not its position in the strip. - ✕ closes the tab server-side too, cancelling a background job that is still running.
Row actions on the detail grid
When your Group by allows it, selecting rows enables toolbar actions:
| Action | Appears when |
|---|---|
| Set banners OFF | grouped by Banner; also needs update rights on the campaigns |
| Block channel | grouped by Banner and Channel |
| Block / Unblock site | grouped by Site plus Campaign or Banner |
| Block / Unblock placement | grouped by Placement plus Campaign or Banner |
| Preliminary confirm / Confirm / Finalize | grouped by Advertiser alone (or Advertiser + Advertiser Owner) — see Finances & billing |
Each action also needs its own permission — see User roles.
Options and fields
| Field | What it does | Default | Notes |
|---|---|---|---|
| Type of reports | Selects the data source and the report’s shape | General | Changing it resets the rest of the form |
| Validation | Valid or invalid raw-log records | Valid | Log types only, and only where the network stores invalid records |
| Date range | Reporting window | Today | 13 presets + Custom range, each separately permissioned; a range you lack stays listed, greyed with a padlock |
| Time zone | Time zone the query is run in | Select zone (= UTC) | Advanced reports only; applied server-side, so a change needs a re-run |
| Time granularity | Time split of the rows | None | Options depend on report type; each step separately permissioned |
| Columns settings (combo) | Advanced column presets | — | Advanced only, and only in the full (non-simple) advanced view |
| Group by | Row dimensions | none | Your tick order is the column order |
| Split columns by | What runs across the columns | Off | Funnels, per-action splits, attribution, expired windows, custom parameter |
| Filters | Value filters (chips + Add filter) | All | An empty filter is not sent — it means no restriction |
| Publishers / Advertisers filter | Entity scoping trees | all entities | Only the checkboxes filter; both panels share one open/closed state |
| Reset | Clears the whole form | — | Including both tree selections |
Note: the collapsible Columns settings section at the top of the form (the metric matrix) and the Columns settings dropdown in the Advanced row are two different controls that currently carry the same name. The section picks which metrics; the Advanced dropdown picks a named preset of Advanced columns.
Corner cases and gotchas
Corner case: a report with Group by empty and Time granularity None has nothing to break rows on, so it returns exactly one row — the totals for the whole window — and offers no graph. That is the default state of the form, so a first report looks empty of detail even when the numbers are right. Add a Group by, a granularity, or both.
Corner case: Hour and 24 Hours read the hourly aggregates, while every other granularity reads the daily ones. If the hourly data is behind, switching granularity can change the totals or empty the report on a network where the daily one is fine.
Corner case: the Time zone is applied server-side — it sets the query’s UTC offset and resolves the date range in that zone. A report already on screen cannot be re-zoned; change the zone on the Filter tab and run again. It only exists for Advanced reports; every other type is bucketed by the server’s own clock.
Corner case: report tabs live in your HTTP session. A refresh restores them, but a sign-out, a session timeout or a server restart does not — the strip silently drops every tab the server no longer holds, and the reports have to be run again. Save a template to keep the question; see Saved and scheduled reports.
Corner case: the Conversion action split refuses to run with zero or more than 25 actions selected — you get “Please select up to 25 conversion actions for the breakdown” instead of a report. Past 20 columns (actions × attribution arms) the form warns; past 40 it refuses and suggests moving attribution into Group by. The VAST quartile / viewability / interaction presets pick their own actions, so they never trip the first rule.
Corner case: the Conversions column counts only conversions of your own conversion actions. Playback telemetry — the system actions behind VAST quartiles, viewability and player interactions — is left out of it, so one video impression does not inflate the count by the number of events it fired; the money those events carry still lands in Gross and Net. To see the events themselves, group by Action or split columns by VAST quartiles, Viewability or Video player interactions. On a network whose Advanced report runs on compacted logs the count comes from a pre-aggregated figure that still includes them.
Corner case: grouping by Attribution type blanks the delivery metrics rather than repeating them on every row (every non-conversion column comes back empty): one ad-log row is spread across the attribution types present, so summing them would multiply each figure by the number of rows it is spread over. The figures stay available in the un-split report and in the column split.
Corner case: removing Action from Group by silently clears the action-custom-parameter split and its filter values — they only mean anything with an Action grouping.
Corner case: filters you cannot see do not apply. A colleague’s saved report that uses a filter you do not have on screen runs for you without that filter, which is enough to make your numbers differ from theirs.
Corner case: the entity deep link (Analytics on a hover card) applies once and then strips itself from the address bar, so refreshing will not re-apply the entity over edits you have made since.
Per-role notes
- Publisher and advertiser — the Columns settings matrix shows one perspective (Publisher or Advertiser), so the only preset chip is Publisher payout or Advertiser charges; the trees offer no Category or Label pickers.
- Network manager — perspectives, report types, tree pickers and filters follow what your network administrator granted the role.
- Share-limited user — reports cover only the entities shared with you; on a Can View share the row actions stay hidden.