Analytics discrepancies
Why your numbers differ from a partner's, why a report comes back empty, why dashboards and reports disagree, and why figures move after the fact — time zones, freshness, pipelines, filters and permissions.
Your impressions don’t match a partner’s ad server; the dashboard disagrees with a report; yesterday’s numbers changed overnight; a colleague sees different figures in “the same” report. Each symptom below lists causes in order of likelihood, with the check for each.
Some percentage of difference against any third-party system is normal in ad serving — the industry rule of thumb is that discrepancies under roughly 10% are not actionable. Investigate the pattern (systematic gap, one-day spike, one dimension off), not every percent.
Symptom: my numbers don’t match a third party’s
Compare like with like, in this order:
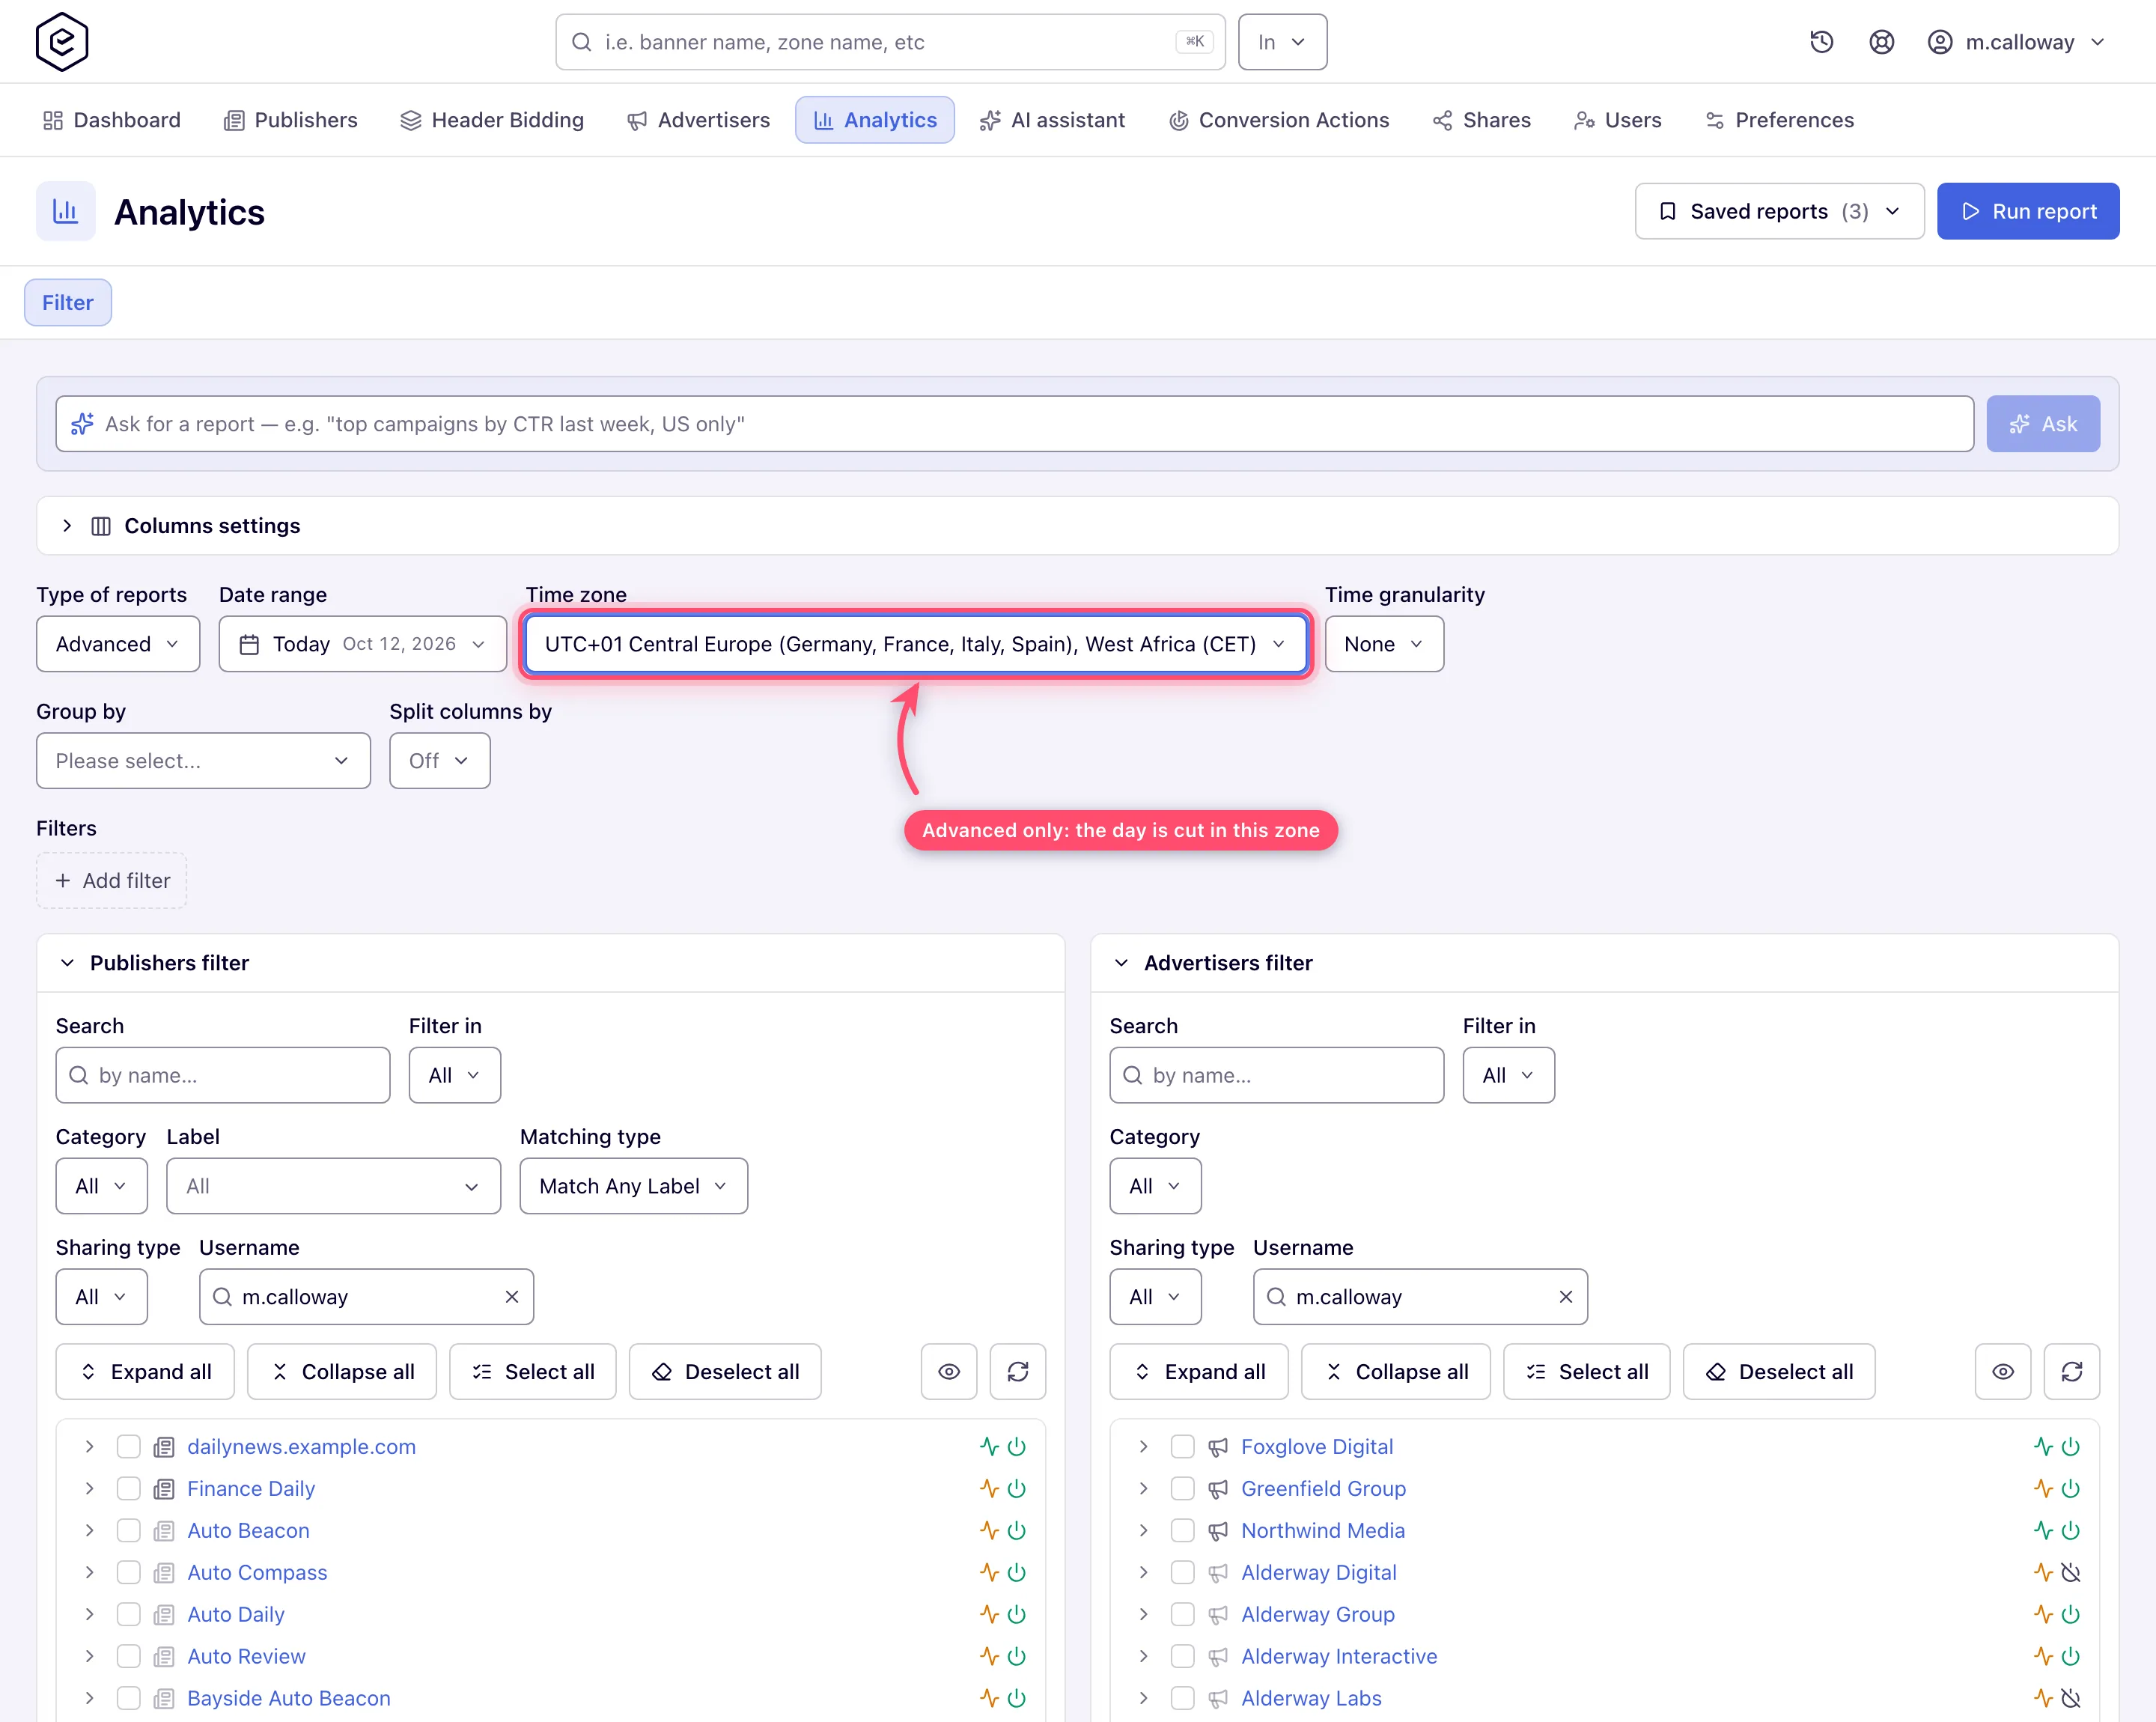
- Time zones. Only the Advanced report has its own Time zone selector; all
other report types (and dashboards) bucket rows in the ad server’s reporting time zone —
see Which time zone do reports use?. A
partner reporting in another zone counts the same events on different calendar days —
the gap concentrates around midnight and evens out over a week. Check: rerun as an
Advanced report with the partner’s time zone selected (Advanced is an administrator-granted
report type — ask your network administrator if it is not in your Type of reports list).
- Metric definitions. Make sure both sides count the same event:
- Requests (ad requests received) ≥ Impressions (delivered and registered ads). A partner’s “ad calls” usually maps to Requests, not Impressions.
- A tag-in-tag chain counts an impression at every hop it passes; each system counts its own hop.
- Net vs Gross revenue (before/after revenue share), and Charges vs Revenue vs Profit are different columns — compare the partner’s “revenue” against the right one.
- Conversions counts real conversions only: VAST playback and viewability events (system conversions) no longer count in Conversions, I2C or CCR, though their money is still summed into Net and Gross. Group by Conversion action or Attribution type to see them.
- Counting moment. An impression is registered when the impression beacon in the served markup is requested (for pops and templates that record their own impressions, when the ad is served), not when the creative renders or becomes viewable; systems that count on render or viewability will read lower on slow pages and in-app traffic.
- Filtered traffic. A beacon request from a bot, from a blacklisted IP or user agent, or with an invalid signature is not counted as an impression (the checks are set under Admin → Validation & anti-fraud → Validation settings), and requests whose user agent exactly matches the built-in list of known crawlers get no ad at all — a crawler outside that list is counted like a visitor. The raw Impressions / Clicks Log reports offer a Validation filter (on networks that store invalid records) — compare valid-only against valid+invalid to size this effect. A third party that counts those requests will read higher.
- Conversion windows. Conversions attribute within the action’s post-view and post-click windows, to the moment defined by the attribution — a partner using a different window or attributing to conversion time instead of click time reports different daily totals. Check the action’s windows under Account → Conversion Actions, and add the Expired post-click conversions / Expired post-view conversions columns to see how many of the partner’s conversions matched an ad event that was already outside your window.
- Attribution method. Partners that count only click-based (or only view-based) conversions will not match your combined total. Compare their number against the Post-click conversions / Post-view conversions split columns (or group by Attribution Type) instead of the total — self-reported and legacy conversions sit in the Unattributed bucket, unless the action’s Default attribution type puts them in the click or view arm instead. Check that setting before reading a split as measured truth: it is what whoever set up the action declared about the integration, not something the ad server observed.
- Ad blockers and privacy modes suppress third-party pixels asymmetrically: whichever side’s beacon is blocked undercounts.
Discrepancy checklist: what to check when your numbers differ from a partner’s
Most “Epom shows X, the partner shows Y” threads end on one of these. Collect them first:
- Same period, same time zone — the partner’s report zone vs the report you ran (above).
- Same event — Epom impression (the ad code ran) vs the partner’s viewable impression, render of its own creative, page view or ad call. Clicks: Epom’s click redirect vs the partner’s landing-page visit.
- Same traffic — only the placements and campaigns the partner sees; a placement with Refresh after (sec) or several slots on a page multiplies impressions per page view.
- Same filtering — Epom excludes invalid traffic from standard metrics; the partner has its own bot filter.
- Hourly shape — group both sides by hour (Epom: an Advanced report in the partner’s time zone). A constant ratio points at a definition difference; a gap in a few hours points at an outage, a paused tag or a limit that was reached.
- Event-level sample — when the totals still differ by more than ~10%, export the Impressions Log or Clicks Log for an hour and ask the partner for the same hour with their transaction / click ids, passed to Epom as a custom parameter.
Why does the advertiser see fewer impressions than the publisher?
Two different questions hide behind this one. Find out which comparison you are looking at.
Inside Epom: advertiser-side and publisher-side impressions of the same campaign
Every impression is written once and counted in three column families of the General report — Basic (the network’s own figure), Publisher and Advertiser (see Column families). All three are labelled just “Impressions”, so two users can look at “Impressions” and be reading different columns. Out of the box the three are equal. When the two sides seem to disagree, it is usually different rows, not different counts. A publisher-side user sees every impression on their placements, from all advertisers; an advertiser-side user sees only their own banners, on all placements. A placement’s total in the publisher’s report is therefore larger than one advertiser’s share of it. Compare one placement and one campaign on both sides (group by Placement and Campaign) before you call it a discrepancy.
What does not split the sides: invalid traffic (bots, blacklisted IPs and user agents, forged or expired impression beacons) is dropped before it reaches any column, so it is missing from the publisher and the advertiser figures alike — see Invalid traffic. Masked campaign names change only the labels, not the numbers. Time zone is the same for both sides in a General report.
Why does the advertiser’s tracker show fewer impressions than Epom?
When the advertiser’s ad server or verification tag shows fewer impressions than Epom:
- Their pixel fires later than Epom’s. Epom counts when the ad’s impression beacon reaches it; the advertiser’s pixel counts when its creative or tag has loaded on the page. A visitor who scrolls on or closes the page in between is in Epom and not in the tracker — the gap grows with heavy creatives, slow mobile networks and in-app traffic.
- Viewable vs served. A tracker that reports viewable impressions is always lower — see the viewability symptom.
- Each side filters differently. Epom removes its invalid traffic; the tracker applies its own bot list on top. Neither side’s filtered traffic shows up in the other’s report.
- The tracker’s pixel did not fire at all — blocked by an ad blocker or privacy mode, or missing from a banner (an HTML banner whose code was replaced, a third-party tag without the advertiser’s pixel). Group a General report by Banner: a banner where the gap is far wider than on the others usually lost its tracking code.
- Time zones. A General report uses the network’s reporting time zone; run an Advanced report in the tracker’s time zone before you compare a single day.
The reverse — Epom lower than the tracker — happens when an impression beacon arrives too late or with an invalid signature: Epom does not count it, while a tracker on the page may. Tags cached and replayed hours later and server-side callers firing beacons in bulk are typical.
Symptom: the advertiser’s tracker counts far fewer clicks than Epom
Epom counts a click when the visitor hits the click redirect, before the landing page starts loading; the tracker counts when its own code on the landing page runs. Everything between the two is lost to the tracker only:
- Landing pages that load slowly or redirect several times — visitors close the tab first.
- Clicks Epom counted but the tracker rejected — the tracker’s own bot or duplicate filter.
- A wrong or empty click URL — a banner whose clickable link is empty or points somewhere else sends the click through Epom and nowhere useful; a third-party tag that does not use the click macro is the opposite case and loses clicks in Epom — see Click tracking with third-party tags.
- Accidental clicks on formats that cover content (sticky, branding, interstitial) inflate Epom clicks and rarely reach a landing page.
Check: group a General report by Placement and Banner, and compare clicks per placement with the tracker’s visits by sub-source. One placement with a far higher CTR than the rest is usually the cause. The Clicks Log shows the IP, user agent and referer of each click.
Symptom: conversions stopped arriving (the tracker shows registrations, Epom shows none)
Work along the path the conversion travels:
- The tracker’s postback is still enabled and still points at your Epom S2S URL — a disabled postback or a changed event mapping in the tracker is the most common cause.
- The click id reaches the tracker. The landing URL must still carry the click macro after the last edit of the banner; without it the tracker has nothing to send back.
- The conversion action is still switched on for the campaign (its Conversion actions card), and its attribution windows still cover the delay between click and conversion.
- Epom received the call — send a test conversion and read why it did not count, see Test a conversion and Read why a pixel did not count.
Symptom: Epom impressions are higher than the partner’s viewable impressions
An Epom impression means the ad’s code ran on the page; it says nothing about whether the ad was seen. A partner counting viewable impressions — 50% of the ad on screen for a set time — will always be lower, most of all on long pages and below-the-fold slots. For video, Epom can measure viewability itself and report it as conversion-action columns (Split columns by → Viewability), see Viewability and Open Measurement. Compare the partner’s viewable count with those columns, not with Impressions.
Symptom: impressions in the wrong country or city (VAST, geo database, outside targeting)
- The country is decided at the ad request. Targeting and the country of the impression come
from the IP that called the ad tag. When that caller is a server — a video player’s or SSP’s
server, a server-side ad insertion stitcher, a proxy — the country is the server’s, unless the
caller forwards the viewer’s IP (
clientIp,X-Device-IP,X-Forwarded-For), see Serving behind server-side ad insertion. - Location (city) and IP are read from each hit. The impression and click rows take the region, city and IP of the pixel or click request itself; a pixel fired from a server reports the server’s city even when the request’s country was right.
- Two geo databases differ. Epom resolves IPs with the provider set for your network (Ip2Location or MaxMind; ask Epom support or your account manager which one). A partner on the other provider puts a share of IPs — mobile carriers, VPN exits, new ranges — in a different country or city. Country-level differences of a few percent are normal; city level differs much more.
- Targeting was not where you think. Another campaign linked to the same placement with wider geo targeting fills those countries — group by Country and Campaign to see which one.
Symptom: more impressions than page views (auto-refresh, several slots)
Your web analytics shows fewer page views than Epom shows impressions — or an SSP and a DSP both count more impressions than you have page views. Usually all of them are right:
- Auto-refresh (autorefresh). A placement with Refresh after (sec) above
0requests a new ad every that many seconds while the tab is visible. Each refresh is a new request and, once it renders, a new impression — one page view with a 30-second refresh and a reader who stays three minutes is six impressions. Lengthening the interval reduces the ratio; only0removes it. - Several slots per page. Each
<ins>tag on a page is its own request and impression; three placements on an article are three impressions per page view. - Single-page apps and infinite scroll. Your analytics may count one page view for a
session while the page calls
init()for each new route or feed item, and every new slot is a new impression. - Pops and redirects count one impression per redirect served, which has no page view of its own on your site.
- What is counted. An impression is counted when the delivered ad markup runs in the browser — not when it is viewable and not when a third party’s code inside it has finished loading. Systems that count on viewability or on their own render are lower.
Check: group a General report by Placement and compare impressions per placement with that page’s views — a ratio far above the number of slots on the page points at refresh.
Symptom: pop or direct-link numbers differ from the traffic source
A traffic source that sends visitors to your direct URL counts the visits it sent; Epom counts the redirects it served. Expect a larger gap than for banners:
- No-ad answers. A request that no banner can serve — capped, out of targeting, over a
limit — gets a
404and a no ad, not an impression. Remove caps and targeting temporarily to measure the raw gap. - Impressions only for counting templates. A redirect counts an impression only when the template has Template impressions record ticked (or the banner is an OpenRTB pop) — see what counts.
- Filtered traffic. Bots and invalid traffic are excluded from standard metrics; pop traffic carries more of both.
- Find the bad sources. Ask the source to append its sub-source ID as a custom parameter
(
&cp.source={source_id}) or as the channel (&ch=…), then group by Channel, or break an Advanced report down by that custom parameter, and compare per source. A per-impression comparison is possible when the source passes its transaction or click ID as a custom parameter and you export the raw Impressions Log.
Symptom: ad blockers — would my own serving domain help?
Requests an ad blocker stops never reach Epom, so they appear on neither side as an Epom request or impression — but a publisher’s page-view counter or an advertiser’s tag may still see the visit. Blockers work from lists of domains and URL patterns: a dedicated serving domain helps only until it lands on such a list, and does nothing for the creative’s own domains (an advertiser’s or DSP’s assets, trackers and VAST files), which are blocked regardless of where the tag came from. Your network’s serving domains are chosen per placement under Ad Tags & API → Settings → Domain.
Symptom: video — many “No ads” or fill rate differs per advertiser
- In an Advanced report, No ads counts every time the ad server answered without an ad and every time a video player fired the Error URL of an ad Epom returned. A third-party VAST tag that turned out empty in the player therefore lands in No ads even though Epom returned an ad for that request.
- Fill Rate in General is per placement: a request is filled when any banner served. Requests cannot be split by advertiser (the request happens before an advertiser is chosen), so there is no per-advertiser Fill Rate in General — see My fill rate is low. For a per-network picture of a VAST setup, compare each banner’s impressions with the requests of a placement that carries only that banner, or use the Advanced report’s no-ad columns.
Symptom: conversions dropped after shortening an attribution window
Shortening an action’s post-click or post-view window (Account → Conversion Actions → action) immediately disqualifies every conversion whose matching click or view is now older than the window — the drop is expected, not data loss. To size it, add the Expired post-click conversions and Expired post-view conversions columns to a General report (they are opt-in — pick Expired windows under Split columns by, or tick them in the report’s Columns settings): each matched-but-out-of-window conversion is recorded there as a zero-revenue diagnostic instead of vanishing. If the expired columns roughly equal the missing conversions, the window change explains the drop; widen the window (or accept the stricter attribution) deliberately. Note the expired diagnostics are excluded from all conversion and revenue totals and never trigger CPA pricing, capping, limits or piggybacks — and conversions recorded before the attribution feature shipped report as Unattributed, not as expired.
Symptom: S2S conversions started expiring after an action setting changed
A server-to-server postback is only measured against an attribution window when it claims a click or a view. Two settings on the action can start such a claim where there was none: Default attribution type (set to Post-click or Post-view, it classifies every postback that declares nothing) and Apply attribution window to server-to-server conversions (ticked, it lets the windows apply to S2S at all). Switching both on turns postbacks that used to count unconditionally into window-checked ones, and the late ones become zero-revenue Expired post-click conversions / Expired post-view conversions rows.
Check, in this order: the action’s Default attribution type, the S2S window checkbox, then the two window values against the partner’s real conversion latency (trials and delayed approvals can be weeks). The Conversions Log’s Attribution Type column shows which arm the conversions moved into. The effect ramps up over days rather than appearing at once, because stored values expanded before release 149 carry no timestamp and keep counting until the partner’s database rotates them out. Reverting the default to Unattributed stops the expiry for postbacks that declare nothing; conversions already recorded as expired stay as diagnostics.
Neither setting takes effect the second you save it. The ad servers read action settings from a cache reloaded on a schedule — every 10 minutes on a standard network — so both the change that started the expiry and the change that stops it land up to one reload later. Judge a test postback only after that.
Symptom: my report is empty
A report with no rows (or a single row of zeros) has one decisive cause far more often than “no data was lost”. Check in this order — the first one that applies is usually the answer:
- The dates. A period that starts after today has nothing yet. Dates are counted in the report’s time zone, so “today” early in the morning can still be empty.
- Permissions. The report type (General / Advanced), the time breakdown (Hour, Day…), each grouping and each filter has its own reporting permission; the console simply does not offer what your role lacks, and over the API the report is refused. A role without the Impressions column, or without any column set (base / publisher / advertiser), gets rows with no delivery figures. A role on the publisher- or advertiser-side column set reads those figures only — a period where they were never filled reads as zero for it while the network’s own report shows traffic.
- How far back the data goes. Hourly General statistics are kept for a shorter time than daily ones — an old period broken down by Hour is empty while the same days by Day are not. The Advanced report keeps its event logs for the number of days the network is configured for; older periods are empty there but not in General.
- The filtered entities. An advertiser, campaign, banner, site, zone or placement id that does not exist or is not shared with you filters everything out; so does one created after the period. Filters also have to agree with each other: a campaign of another advertiser, a banner of another campaign or a placement of another site next to each other match no row.
- Advanced only — the data itself. The Advanced report sees an hour only after its event logs have loaded, so today (and, when loading lags, yesterday) can be empty while General already shows delivery. And a filter on a request detail that the network’s compacted Advanced data does not keep (device format, connection type, language, incognito on many networks) matches nothing.
- The filters together. If none of the above applies, run the General report for the same dates without filters: empty means nothing was delivered at all in the period (see My ad is not serving); if it has impressions, add the filters back one at a time — the one that empties the report is the one to question.
Ask the assistant: “why is my report empty?” with the same dates and filters — its report check goes through this list and, when the setup explains nothing, runs the General report without filters and then without one filter at a time (up to five analytics requests, counted against your daily limit) to name the filter that leaves nothing. Over the API:
GET /rest-api/analytics/report-check(it never runs the report itself).
Symptom: dashboard and a report disagree
- Different periods. On the publisher/advertiser dashboards every block reports the window in the header’s period control, and each card states it on a pill — read that pill first, then check the report’s own date range covers the same days. A “Today” dashboard still moves while a report you ran an hour ago does not.
- Different report definitions. Table/chart widgets on the main dashboard render a saved report each — open the widget’s settings to see which report and period it uses; the dashboard’s global period override can silently reframe every widget.
- Different source. A table or chart widget runs a General or an Advanced report (the only two types that load data in a widget). Comparing a General widget against an Advanced report mixes two pipelines — see the next symptom.
Symptom: two reports over the same dates disagree
- General vs Advanced/logs read different data. General reads aggregated statistics and Advanced and the log reports read the event logs; the two are loaded on separate schedules (every hour by default, and Epom support or your account manager can shorten them). For recent hours the two can therefore disagree, in either direction.
- Advanced/log results are cached per query. Rerunning the same query returns the cached result until new data has loaded — two runs minutes apart should be identical, and a run after the next hourly load can differ. See Report types for freshness per type.
- “Today” is always provisional in Advanced and log reports; the last minutes-to-hours of the day arrive with the next hourly loads. For final numbers, report on yesterday or earlier.
- Group-by dimensions can drop rows. Advanced reports may exclude dimensions that are not carried by the compacted analytics data — a filter on such a dimension can legally return zero rows while the totals report shows traffic. If a filtered Advanced report returns nothing, retry without the exotic dimension before concluding data loss.
Symptom: numbers changed after the fact
- Late-arriving data. All report types backfill the recent past; small upward revisions of yesterday are normal until all logs land.
Symptom: a colleague sees different numbers / columns in the same report
- Sharing scope. Reports only include entities you can view. A user with fewer shares sees smaller totals — same report, different data slice.
- Column permissions. Column families (base / publisher / advertiser) and individual columns (revenue, profit, eCPM…) are permission-gated; group-by and filter options are too. The report is not “missing data” — your role hides those columns. Compare roles, not reports.
- Different report type or view. The analytics view level (simple/extended) changes available columns in Advanced reports.
When to involve Epom support
Escalate to Epom support or your account manager with the report type, filters, period, time zone and the two numbers compared, when:
- a General report contradicts raw serving evidence (e.g. the publisher’s server logs) by far more than the usual few percent, for multiple days;
- Advanced/log reports stopped updating — data lags by more than a day (Epom can check the analytics pipeline and clear the server-side report cache).