Dashboards
The main widget dashboard and the publisher/advertiser dashboards — widget types, add/edit/reorder, the global period override and first-run onboarding.
Account → Dashboard is your standing overview. Which of the three dashboards you land on is decided by your role’s report-column permissions, checked in this order:
| Your role has | You get |
|---|---|
| Base report columns | the main widget dashboard — a configurable two-column board |
| Publisher report columns (and not Base) | the publisher dashboard — KPI tiles, a trends chart and a Publisher/Zone/Placement tree |
| Advertiser report columns (and not Base) | the advertiser dashboard — the same layout with advertiser metrics and an Advertiser/Campaign/Banner tree |
| none of the three, or no Dashboard tab | an Access denied line |
There is no switch between them: the tab renders whichever one your permissions select.
Who this is for
Every account role. Which board you get follows the table above, and the “(and not Base)” condition does most of the work: a role holding Base columns lands on the widget board whatever else it holds. The shipped Publisher role holds the Publisher family and not Base, and the shipped Advertiser role the Advertiser family and not Base, so they land on the publisher dashboard and the advertiser dashboard respectively. The shipped Network Manager role holds Base columns, so a network manager lands on the widget board.
Prerequisites
- Entities with traffic — without it every widget reads No data for this period. An account with no advertisers and no sites at all gets the three-step onboarding panel as well (below).
Steps: working the main widget dashboard
-
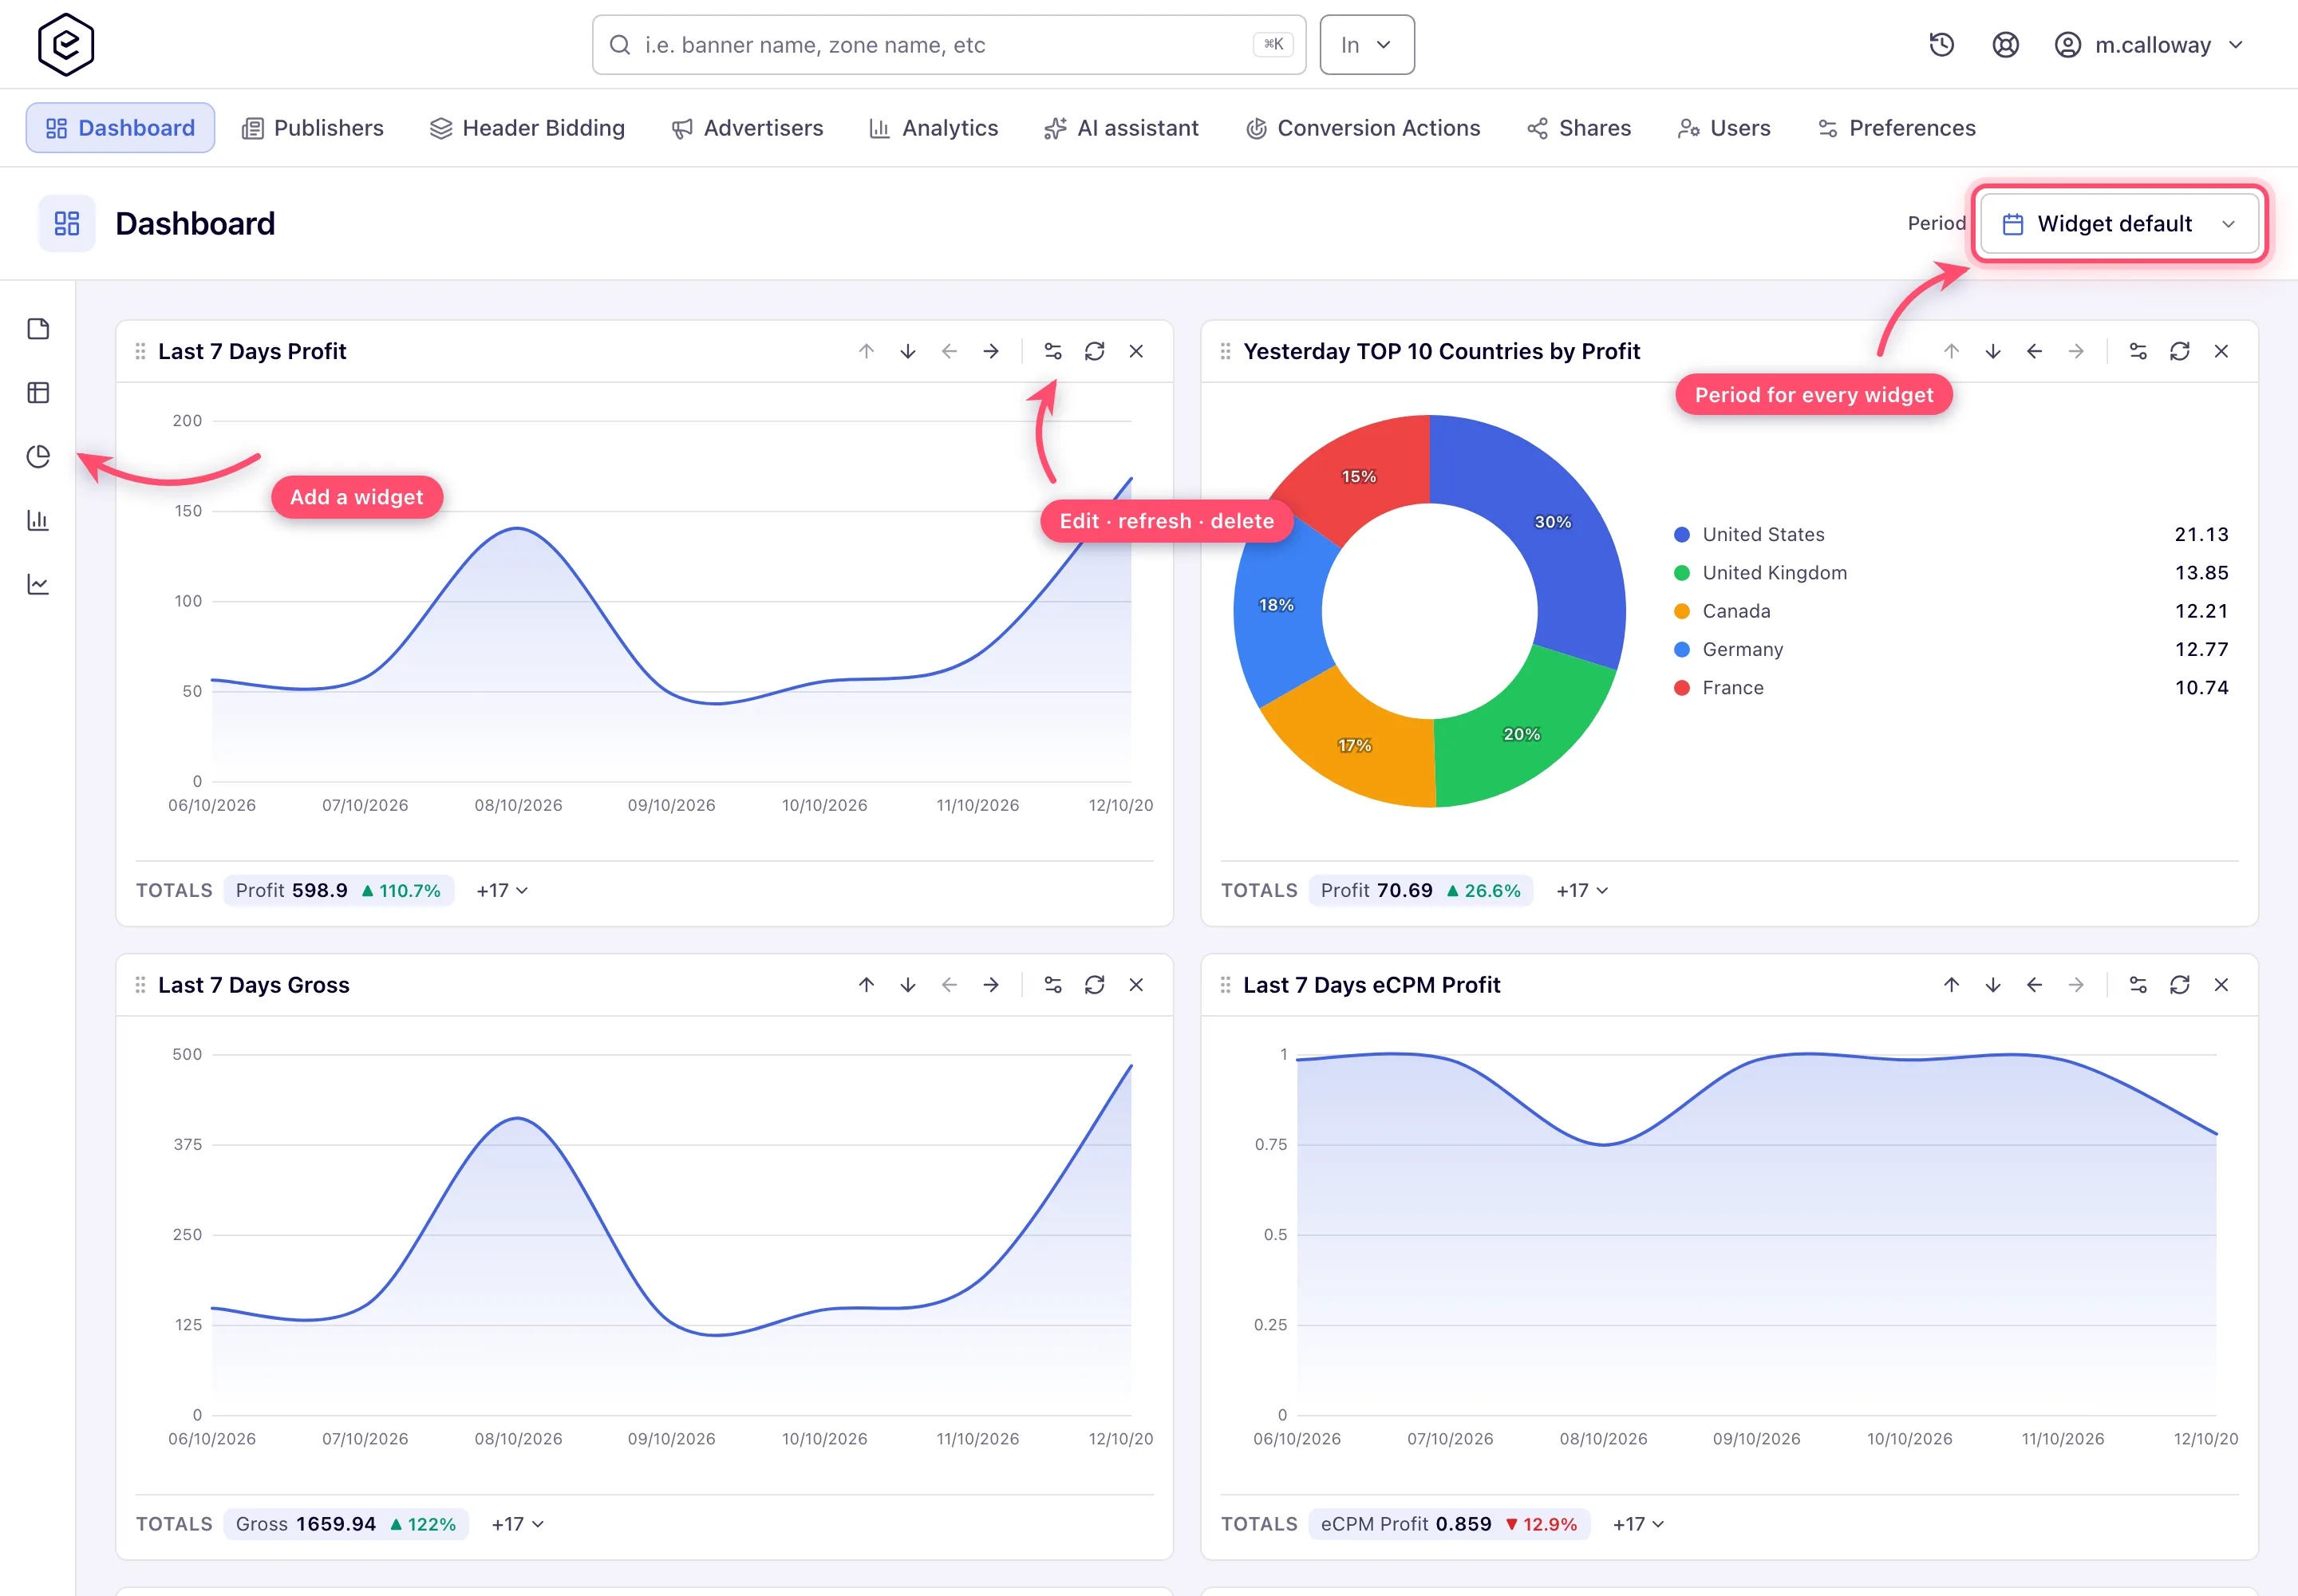
Go to Account → Dashboard. Your account was seeded with a starter set of widgets when it was created — up to ten, titled in your own language.
-
Add a widget from the icon rail down the left edge. Five types:
Widget What it draws Metrics Group by / Breakdown by Note Free text you type. No data, no period. — — Analytics table A mini report grid — one row per group or time bucket, your metrics as columns. Grouped tables come back sorted by impressions, highest first. several at least one of the two Pie chart One doughnut, one slice per group or bucket. exactly one exactly one of the two Bar graph One bar per group or bucket, one series per metric. several exactly one of the two Line chart One line per metric over time; add a Group by as well and you get one line per entity. several at least one of the two -
Fill the dialog (the fields are listed under Options & fields) and press Submit. Reset puts every field back to how the dialog opened. Submit stays greyed out until Title has something in it.
-
The new widget lands at the bottom of the shorter column — the left one when both columns hold the same number of cards.
-
Rearrange by dragging a card by the grip at the left of its header, or with the four arrow buttons on the card: up and down move it within its column, left and right send it to the other one. Either way the new order is saved immediately, and it is yours alone.
-
Each card’s remaining header buttons are edit (opens the same dialog), refresh (re-asks the server for the widget’s data) and × (delete, after a Delete widget? confirmation).
-
Below every analytics widget sits a Totals strip: a chip per metric with the widget’s grand total for its window, and an arrow next to each figure comparing it with the preceding window of the same length. The widget’s own metric leads; +N opens the full metric-by-perspective matrix (Base, and Publisher/Advertiser where those columns exist).
-
Period in the page header temporarily reports every analytics widget on one window. It offers the same fourteen ranges as the report builder, plus Widget default at the top of the list to hand each widget back its own saved range.
Note: the legacy dashboard’s notifications block is not on this page. Alerts live in the bell in the top bar, where they are reachable from every screen.
Add a widget straight from a report
On an executed report tab, open the Graph panel, choose the metric and click Add to dashboard; the dialog asks for a title, and the widget inherits the report’s range, grouping and filters. This works only for a report that has a Group by and Time granularity None — the shape that charts as bars. Any other shape answers “Current analytics chart report is not compatible with any dashboard widget type” and nothing is created; that is a known limitation, not a rule about which reports deserve a widget. See Run a report.
First-run onboarding
While the account has no advertisers and no sites at all, the board opens with a three-step Welcome! Let’s get your first ad serving panel — set up inventory → add demand → put the ad tag on your page — with buttons into Publishers and Advertisers. There is no dismiss control: it disappears by itself as soon as either tree has an entry. See the network quick start.
Options and fields
What the widget reports
| Field | What it does |
|---|---|
| Title (required) | The card heading. Up to 64 characters. |
| Type of reports | Which report the widget runs — every type your role can run except the four raw-log ones (Impressions, Clicks, Conversions and Actions Log have no widget form). Header Bidding and Targeting Cookie are listed where you hold them, but only General and Advanced widgets load data — see the corner case below. Changing it clears Group by, Range and the country/browser/OS filters. |
| Metrics | The figures to draw. A pie takes exactly one; the other three take as many as you like. Options are grouped Base / Publisher / Advertiser Analytics, and the group name is appended to the label only where two families share a name (three “Impressions” rows would otherwise be indistinguishable). |
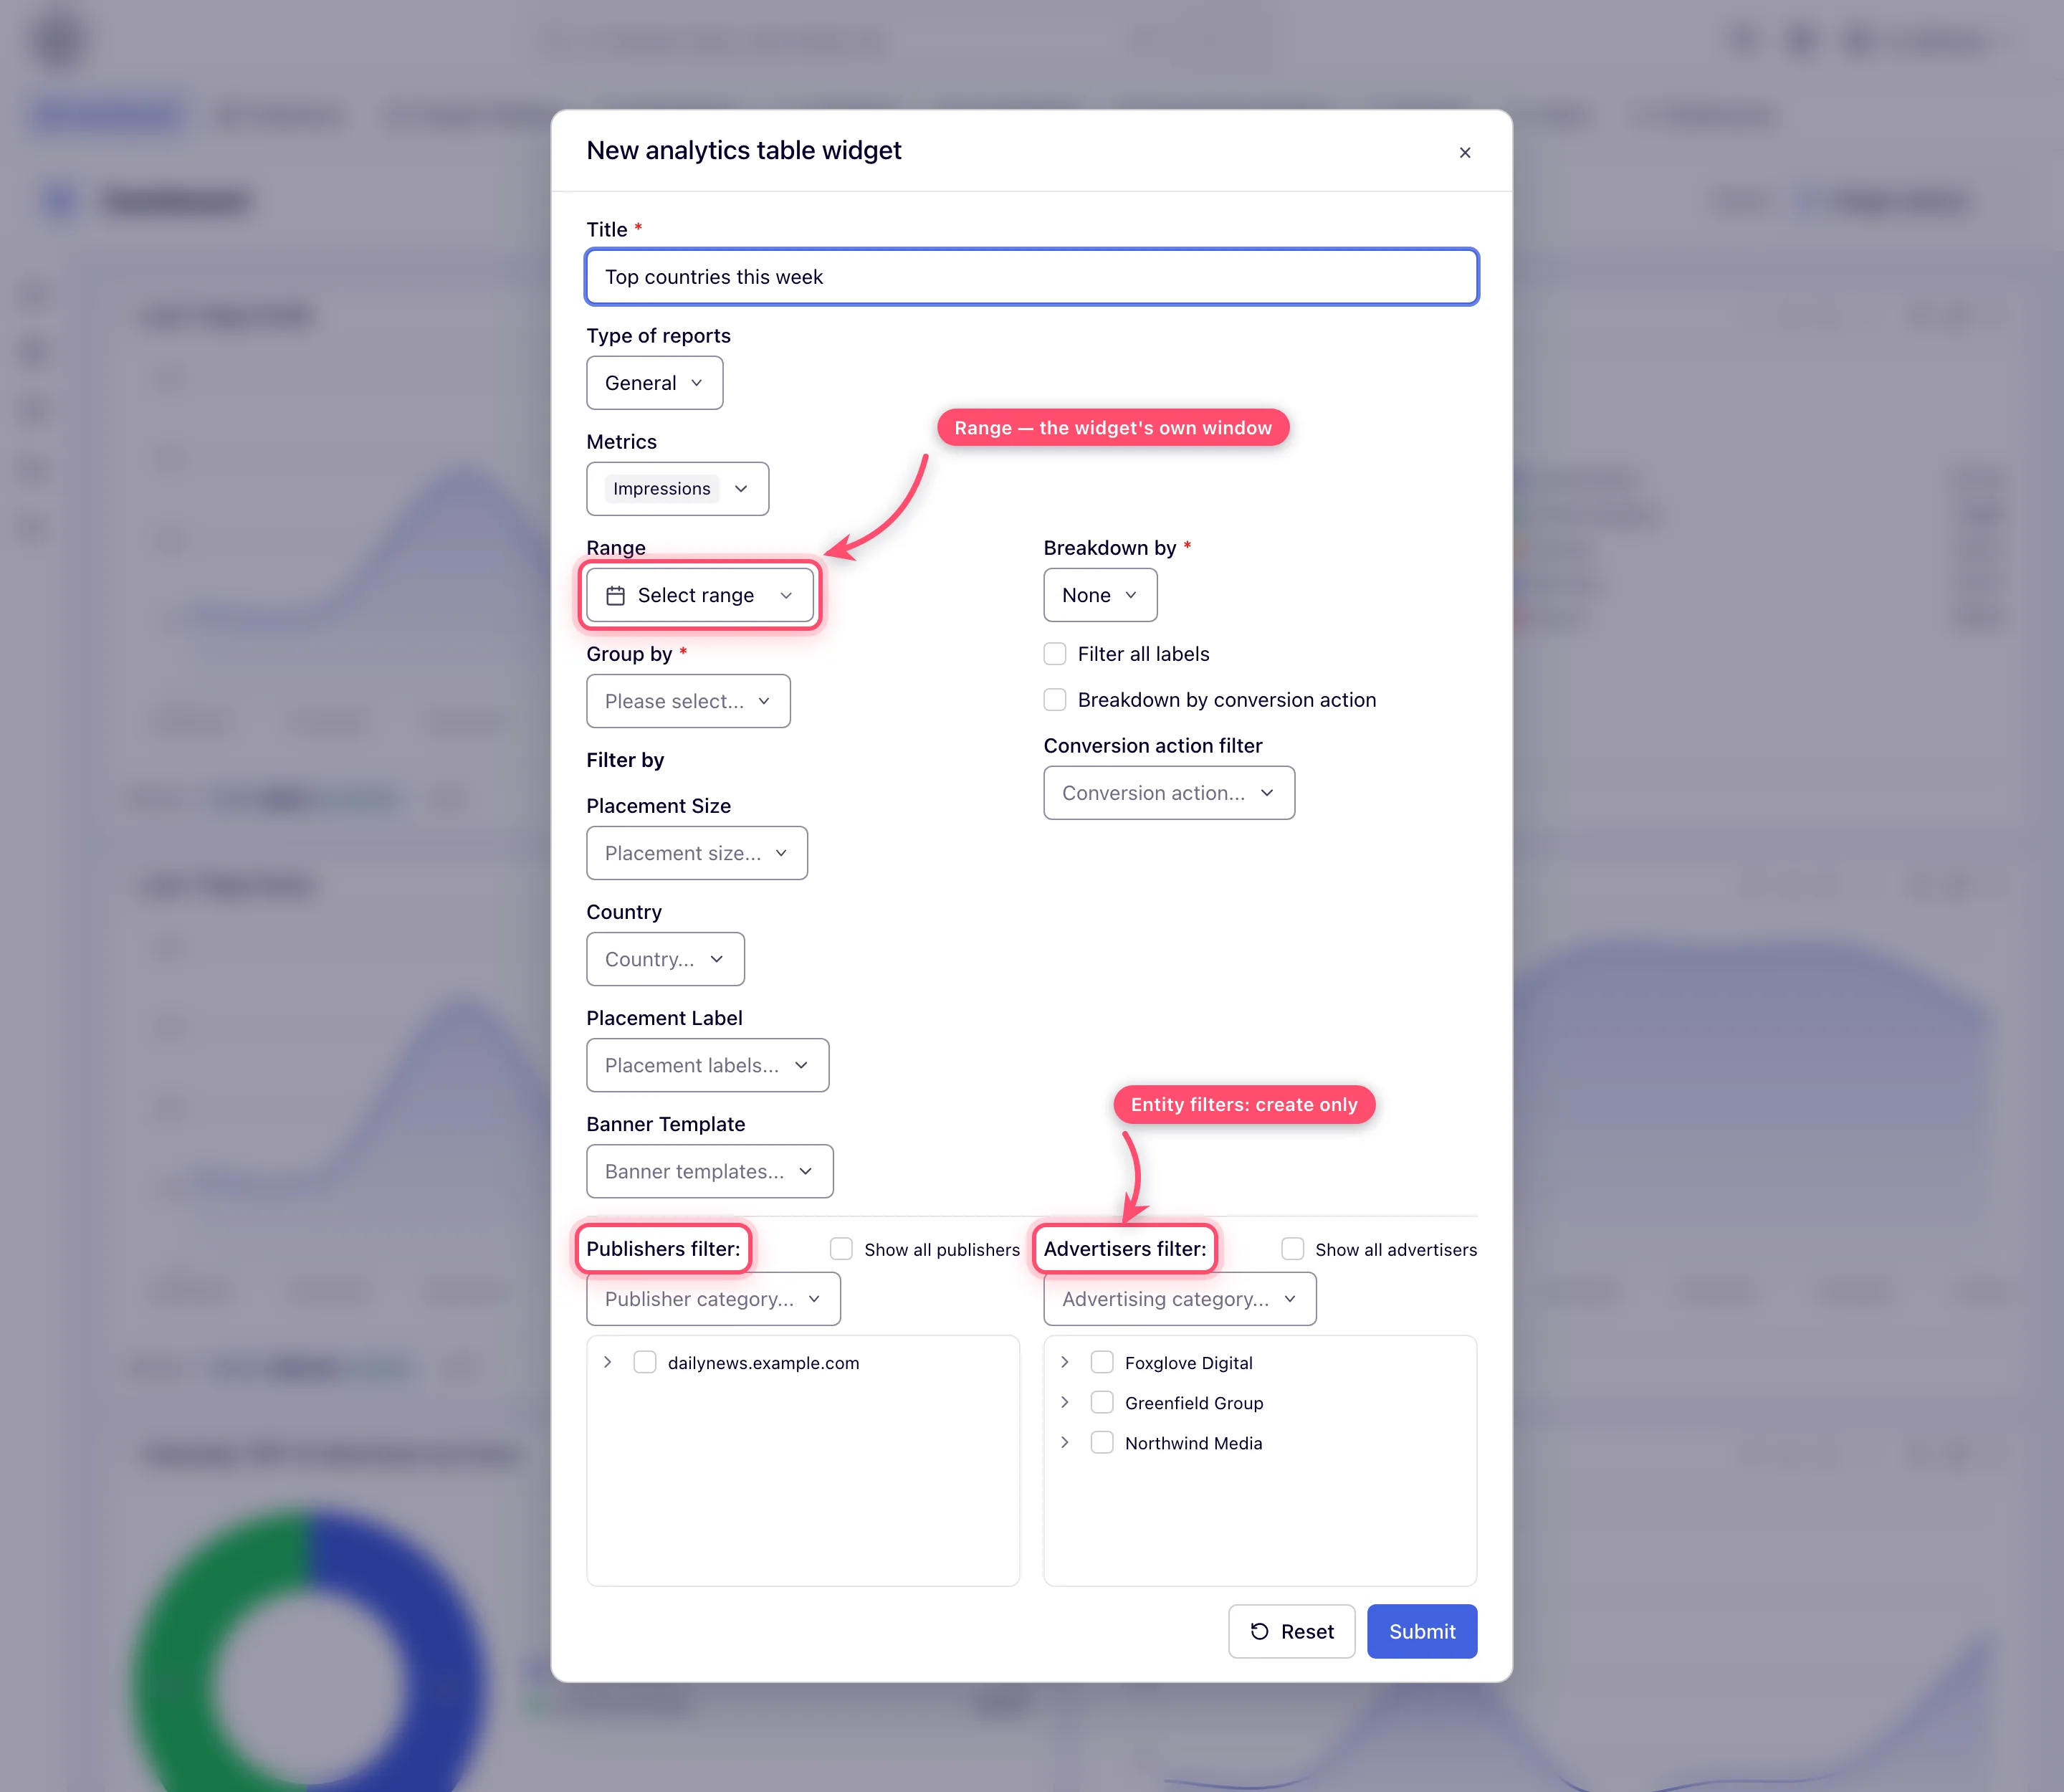
| Range | The widget’s own window, chosen in the same period picker the report builder uses: thirteen presets from Today to Last year, plus Custom range. Leave it on Select range and the widget reports Today. |
| Group by | One dimension to break the rows or slices on — Site, Zone, Placement, Advertiser, Campaign, Banner, Country and the rest of the list your report type offers. |
| Breakdown by | The time bucket: None, Hour, Day, Week, Month, Year, 24 Hours. Every report type other than General drops Hour, Month and Year from this list. |
Filter by
| Filter | Notes |
|---|---|
| Placement Size | A size from the ad-unit list, or Custom with a width × height pair. Does not restrict the widget — see the corner case below. |
| Country | One or more countries. |
| Browser, Operating System | Shown only for report types whose group-by list carries them — Advanced does, General does not. |
| Placement Label, Banner Label | Label filters on placements and banners. |
| Banner Template | Narrows to banners built from the chosen templates. |
| Filter all labels | Appears when either label filter does. Requires an entity to carry all the chosen labels rather than any of them. |
| Breakdown by conversion action, Conversion action filter | Table widgets only. |
| Publishers filter, Advertisers filter | Check-trees that pin the widget to named entities, with a Show all toggle (include inactive ones) and a category filter. Offered when creating a widget only. |
A filter your role may not use is not rendered — see User roles.
A Note widget has just two fields, both required: Title (up to 64 characters) and Text (up to 1024).
Range and Breakdown by have to agree
The server refuses combinations that would bucket a window more finely, or more coarsely, than it can carry. The message lands under Breakdown by:
| Range | Breakdown by may be | Anything else is refused with |
|---|---|---|
| Today, Yesterday | None, Hour | Must be Hour |
| Current week, Last week, Last 2 weeks, Current month, Last month, Last 7 days, Last 30 days | None, Day | Must be Day |
| Last 3 months, Last 6 months, Current year, Last year | None, Week, Month | Must be Month or Week |
| Custom range | any, including 24 Hours | — |
24 Hours therefore only ever pairs with a custom range.
Steps: reading the role dashboards
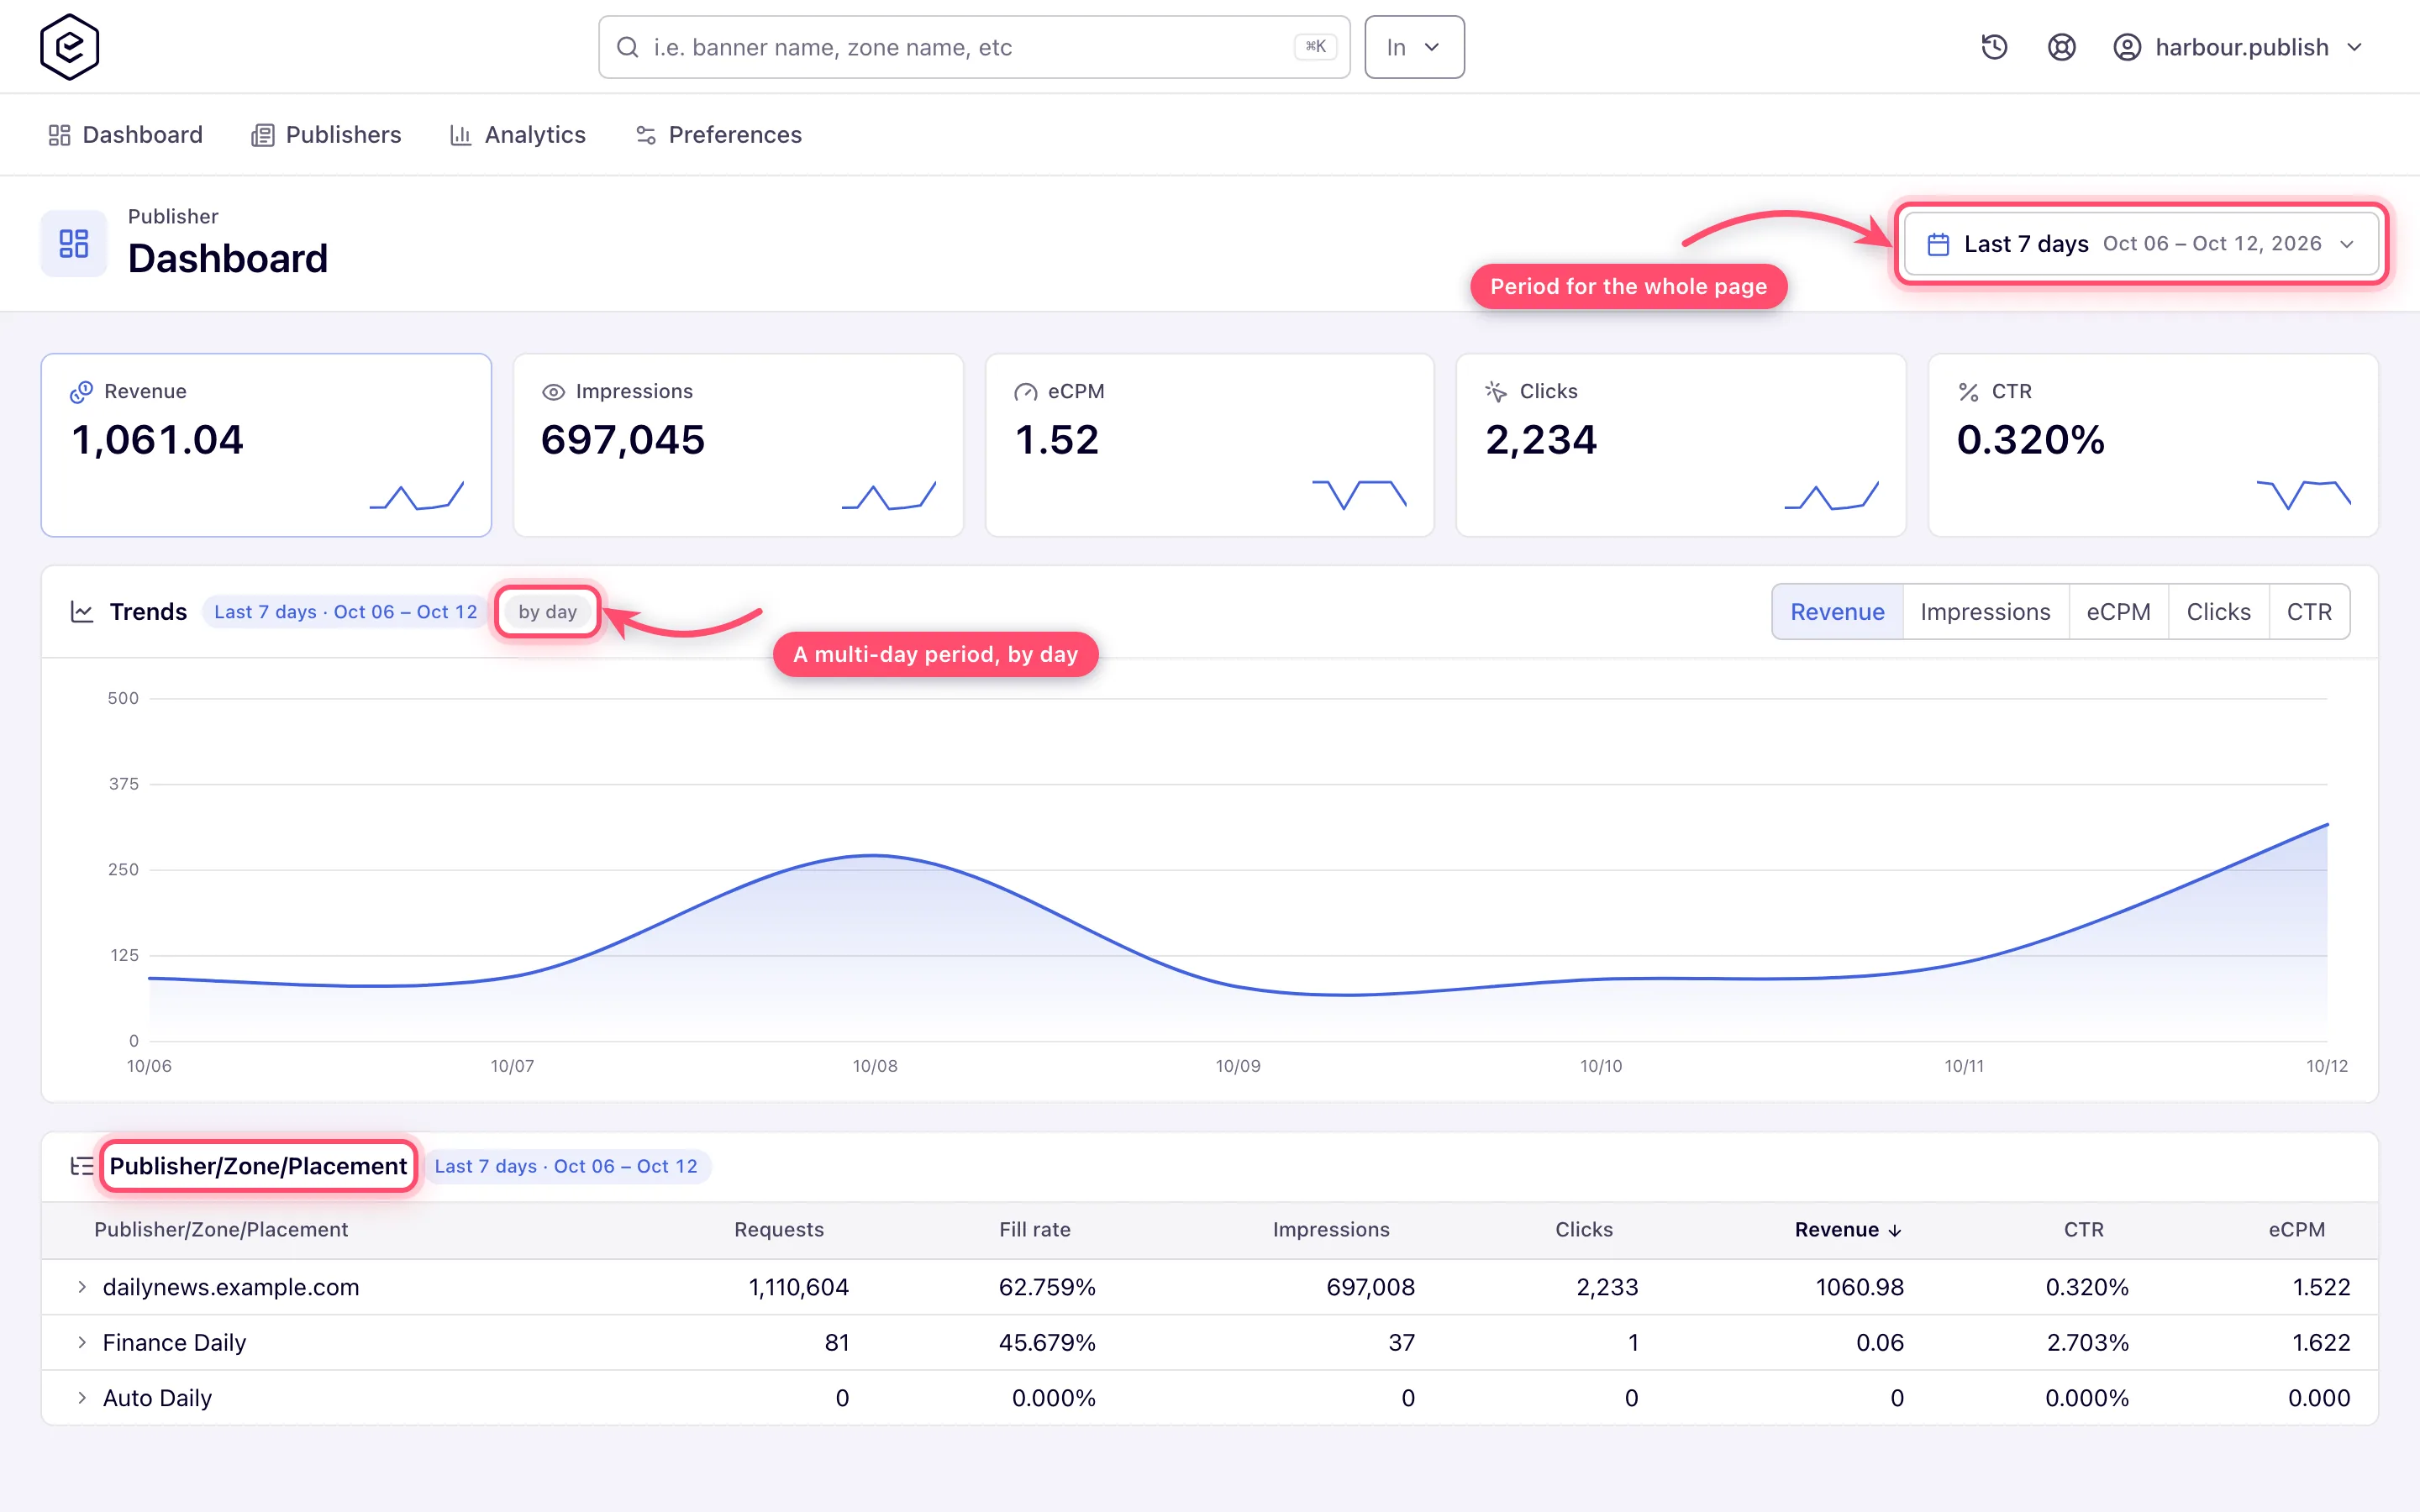
- Set the window once in the period control in the page header. The KPI row, the chart and the tree all report it, and each card repeats it as a pill so a single card still says which dates it covers. The list carries all fourteen ranges; a range you cannot report on stays in the list, greyed out with a padlock, rather than vanishing.
- The KPI row shows the window’s total for each metric — Revenue, Impressions, eCPM, Clicks and CTR on the publisher side; Charges instead of Revenue on the advertiser side — each with a sparkline of the shape within the window.
- The Trends card charts one metric at a time; switch with the segmented control. The step follows the window and is written on the card: a single-day window is charted by hour, anything longer by day. On Today a dashed now rule marks how far the day has run, so the curve flattening to zero after it doesn’t read as a traffic collapse.
- Tick Compare with previous period in the picker to add the preceding window of equal length: a dashed baseline on the chart, and a change chip on each tile captioned with the dates it is measured against.
- The breakdown tree — Publisher/Zone/Placement, or Advertiser/Campaign/Banner — drills down through the same window. It is sorted by revenue (charges on the advertiser side), highest first.
Corner cases and gotchas
Corner case: to restrict a widget by size, group by Placement Size instead of using the Placement Size filter, which the widget does not apply; or build the report in Analytics.
Corner case: widgets support General and Advanced reports only. The dialog also lists Header Bidding and Targeting Cookie where you hold them, but a widget on either shows an error such as Cannot get data for widget — build the widget on General or Advanced, or run the report in Analytics.
Corner case: the Publishers and Advertisers filters can only be set while creating a widget. The edit dialog hides them, and editing a widget does not disturb them. To change a widget’s entity scope, delete it and create it again.
Corner case: the header Period is a viewing aid, not a setting. It is not saved: reload the page and the board is back on Widget default, with each widget on its own range. It also overrides every analytics widget — including one whose own range is a custom date pair. There is no way to exempt a widget from it.
Corner case: a preset range is re-resolved every time the widget renders, so a Last 7 days widget always means the seven days ending today, never the seven days that were current when you configured it. Only Custom range pins actual dates.
Corner case: leaving Range on Select range does not mean “no window” — the widget is saved as Today. Pick Day for Breakdown by without touching Range and the save is refused with Must be Hour, which reads like a bug until you know Today is what is being enforced. Set the range explicitly.
Corner case: on a pie or bar widget, Group by and Breakdown by are mutually exclusive — setting one clears the other in the dialog, and sending both is refused with Must select ‘Group by’ or ‘Breakdown by’. On a table or line widget both may be set, but at least one must be, and the same message appears under both fields when neither is.
Corner case: if you name a widget with one of the two dozen stock widget titles (Today By Sites, Last 7 Days Profit, Yesterday TOP 10 Countries by Profit and their siblings), the card shows the translated stock title instead of what you typed. In English the two are identical, so nothing looks wrong; in any other language your title is silently replaced. The edit dialog still shows what you actually typed. Vary the wording — Last 7 days profit (EU) — if you want the title you wrote.
Corner case: a chart is capped at the network’s top-N (10 unless Epom changed it for your network), but the two shapes handle the overflow differently. Pie and bar keep the top N and fold the rest into a single Other entry; pie additionally drops anything zero or negative, so a slice can be missing rather than drawn at zero. A line widget with both a group-by and a time breakdown keeps the top N entities by the first metric and drops the rest outright — there is no “Other” line, so the chart’s totals will not add up to the strip beneath it.
Corner case: a chart widget whose metric does not exist for its grouping — an advertiser-side metric grouped by a supply-side dimension, say — cannot draw anything. The card says which metric is at fault and tells you to edit the widget, instead of showing the generic No data for this period.
Corner case: refresh does not force a fresh query. A widget’s rows and totals are cached on the server for 30 minutes, keyed on the widget’s configuration and window, and the refresh button does not bypass that — it just re-asks. So a figure can be up to half an hour behind, and the reliable way to get a new number sooner is to change the widget (any edit changes the key) or to move the global Period, which asks for a window the cache has not seen.
Corner case: the board is exactly two columns wide. Widgets never spill into a third, however many you add.
Corner case: the breakdown tree on the advertiser dashboard renders only for accounts on the tree-style UI preference. Grid-style accounts get the KPI row and the trends chart without the tree. The publisher dashboard’s tree has no such condition.
Corner case: the role dashboards do remember their window, unlike the widget board’s Period — but in the browser, not in your account. The publisher and advertiser dashboards keep their own separately, and both start again at Today in a different browser or after site data is cleared.
Corner case: the dashed now rule is drawn from the clock of the machine you are looking at, in UTC, while the curve is plotted in the network’s reporting timezone. On a network that does not report in UTC the rule sits an hour or several to the side of where the data actually stops. It is an orientation mark, not a data boundary.
Corner case: charting a single day by hour needs the hourly-breakdown reporting permission. Without it a one-day window yields one point, and the Trends card says A single day has no daily trend — widen the period, or ask for hourly breakdown access rather than drawing a one-point line.
Per-role notes
- Publisher and advertiser — the publisher or advertiser dashboard: KPI tiles, a Trends chart and a breakdown tree, with no widgets. Figures are payout (publisher) or charges (advertiser).
- Network manager — the widget board once the role may read Base columns; the widget metric list follows the role’s column perspectives.
- Share-limited user — the same board, aggregating only the entities shared with you.
- Everyone — widgets belong to one login: nobody else sees yours, but people sharing a login share one board.