
DSP partner analytics: bids, wins and revenue
Read a DSP partner's bid funnel — Requests, Bids, Wins, Impressions, Clicks, Revenue, eCPM — per partner, placement, country and day; tell "the DSP is not bidding" from "it is losing the auction"; understand why Revenue follows the pricing model and why Wins sit above Impressions; and export the grid.
DSP partners analytics shows, per partner, how many bid requests went out, how many came back with a valid bid, how many of those won, and what the partner was billed for the delivery it won. The first three are a funnel the ad servers count; the last three — Impressions, Clicks, Revenue — come from the delivery log. Read together they answer the two questions every DSP integration raises: is the partner bidding at all? and is what it won what we invoice?
Example. “Northwind Exchange” received 1,200,000 requests yesterday, answered 48,000 bids (4 %), won 9,600 of them and delivered 9,100 impressions for $38.20 of revenue — an eCPM of $4.20. The 500 wins with no impression are creatives the page never rendered, not lost money; the 96 % of requests with no bid are what to ask the partner about, after checking your floors.
Typical scenarios
| You want to know | Group by | Read |
|---|---|---|
| Whether a new partner bids at all | DSP partner | Requests high, Bids near zero → not bidding, or every bid rejected before the auction |
| Why it wins so little | DSP partner | Bids high, Wins low → it loses to another partner or to direct demand; compare bid prices |
| Which placements it never bids on | DSP partner + Placement ID | Rows with Requests and no Bids — a floor or a format problem on that placement |
| What to invoice a CPC partner this month | Date + DSP partner, last month | Revenue against Clicks: Revenue ÷ Clicks is the agreed CPC |
| Where the money comes from by market | DSP partner + Country code | Revenue and eCPM per country |
Step by step
-
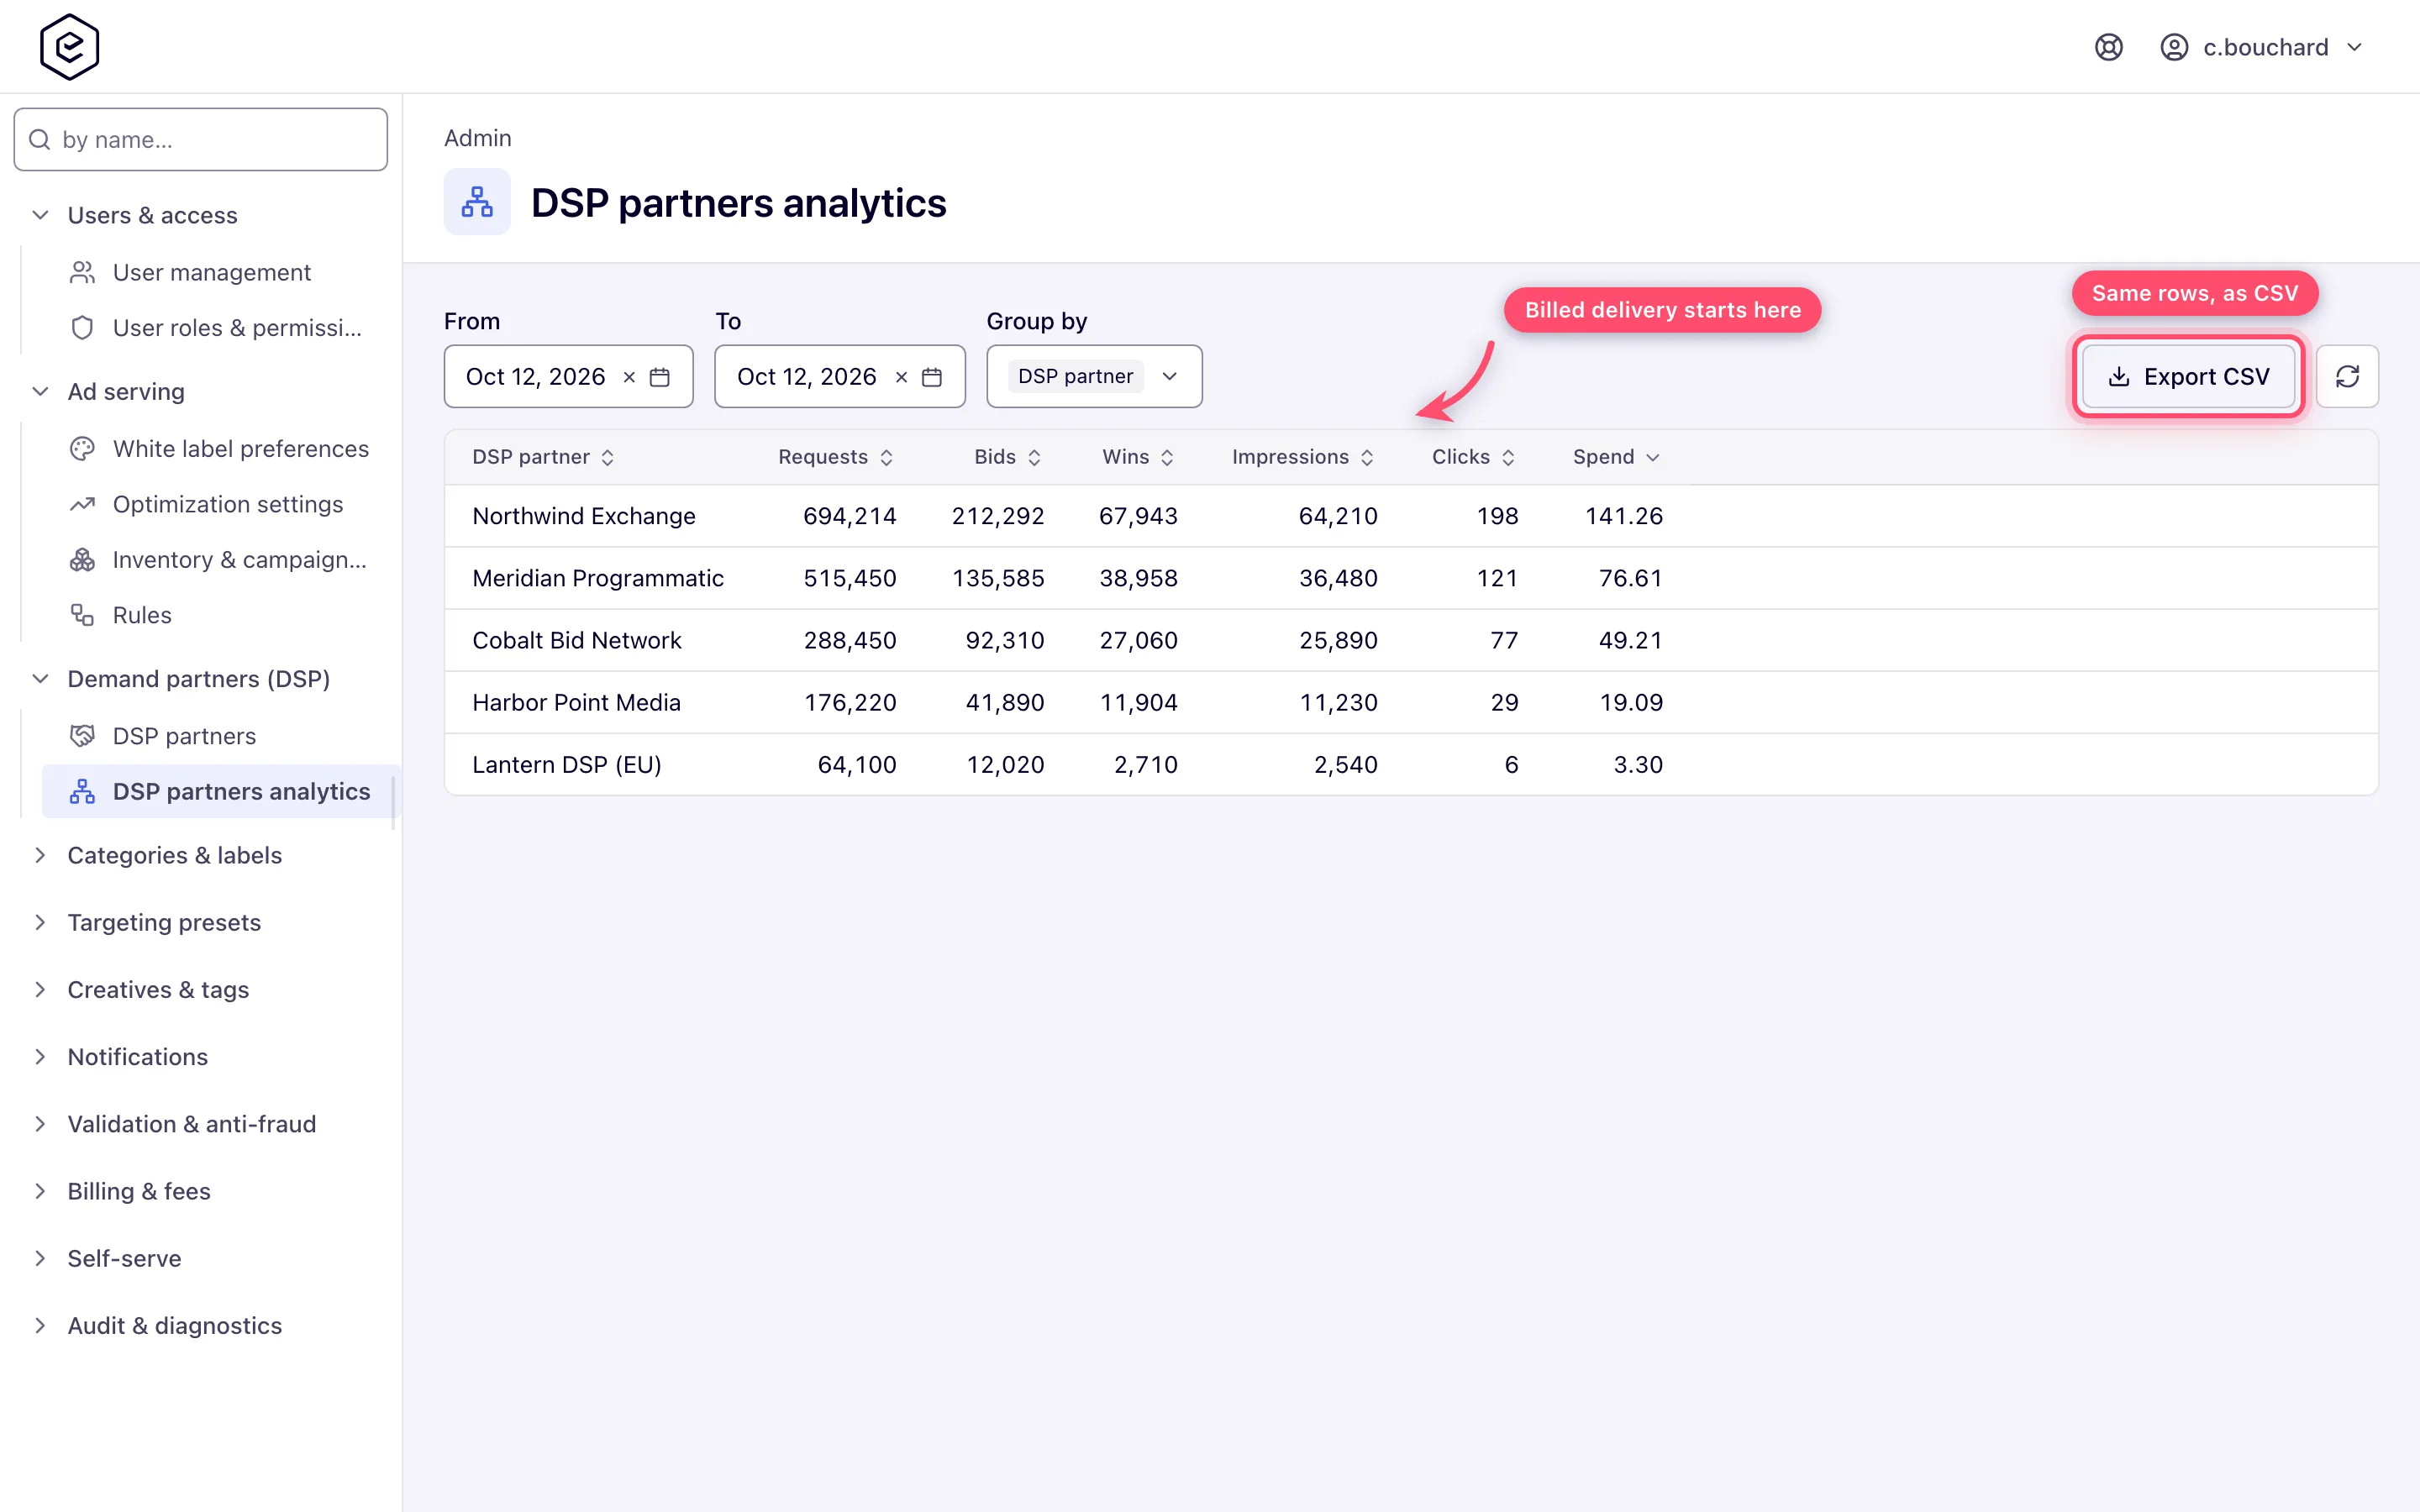
Go to Admin → Demand partners (DSP) → DSP partners analytics (account users: RTB → DSP partners analytics). Pick the date range.
-
Pick any mix of Date, DSP partner, Placement ID and Country code in the Group by multi-select. Ungrouped, the grid is a single total row.
-
Read Requests / Bids / Wins / Impressions / Clicks / Revenue / eCPM. eCPM is each row’s own revenue per thousand of its own impressions, not an average of the rows underneath it, and reads 0 until the partner has served. Use the funnel table below to place the drop.
-
Export CSV, next to the refresh button, downloads the same result set.
Did the DSP not bid, or did it lose the auction? Requests, Bids and Wins per partner
The three counters are a funnel per partner (and per placement, country and date, if you group by them), so the step where the numbers fall off tells you what happened:
| Column | Counts | Not counted |
|---|---|---|
| Requests | Bid requests the ad server sent to the endpoint — counted as the request goes out | Header-bidding quotes |
| Bids | Responses carrying one valid bid: parsed, priced in USD (see Currency in full), one seat with one bid, price at or above the floor (deal bids are exempt from the floor) | No-bid (204 or empty), timeouts, errors, unparsable responses, bids in a currency that could not be priced, bids below the floor or with several seats/bids |
| Wins | Auctions the partner’s bid won with a price and non-empty markup | Bids that lost to another bid or to direct demand |
How to read it:
- Requests high, Bids near zero — the partner is not bidding, or every bid is rejected before the auction (below your floor, wrong currency, malformed). Check floors first (see Which floors to use); a troubleshooting log task names the rejection reason per bid. The partner’s own logs show whether they answered no-bid.
- Bids high, Wins low — the partner bids but loses the auction: another partner or your direct campaigns paid more. Compare its bid prices with the winners’ before raising floors.
- Wins above Impressions — the auction was won but the creative did not render (see What Revenue counts). A bid that is counted and then dropped later — a creative blocked by creative scanning, markup missing — is still a Bid.
What Revenue counts
The six metrics come from two different places, unioned per (date, partner, placement, country). Requests / Bids / Wins are the auction funnel, counted by the ad servers. Impressions / Clicks / Revenue come from the delivery log, joined to the endpoint through the banner that served.
That split is why Revenue is what the partner was billed for delivery its endpoint won, not what it won at auction: an auction the partner won but whose creative never rendered adds a Win and nothing else. Wins above impressions is normal — the gap is creatives that lost the render, not lost money.
Which event was billed depends on the partner’s pricing model, and Revenue follows it without you having to say so:
| Pricing model | Billed on | Read the rate as |
|---|---|---|
| CPM | Impressions | Revenue ÷ Impressions × 1000 |
| CPC | Clicks | Revenue ÷ Clicks |
| CPI | Impressions | Revenue ÷ Impressions — the win price is booked per impression, not per thousand |
Impressions and Clicks are there so the rate can be checked against the deal. A CPC partner will show Revenue against a low click count and a large impression count — that is the model working, not a discrepancy.
Revenue for a partner is the sum over every OpenRTB creative pointing at it, so it equals the Gross the standard report shows for those creatives, and the two reconcile line for line. Creatives deleted since still count: the link that attributes an impression to an endpoint survives the deletion, so historical invoices do not shrink when someone tidies up a campaign.
To pull the same figures for invoicing rather than reading them off the screen, see DSP endpoint traffic and spend.
Export the analytics grid
Export CSV, next to the refresh button, downloads the current result as a CSV file. The export carries the date range, the group-by selection and the sort you have on screen, but not the page window — the file holds every matching row, not just the visible page.
The columns follow the grid: only the dimensions you grouped by become columns, while Requests, Bids, Wins, Impressions, Clicks, Revenue and eCPM are always present. So a grid grouped by date and partner exports nine columns; ungrouping partner drops that column from the file too. Both the admin page and the account RTB tab export through the same endpoint, so the file is identical for either login.
Caveats and exceptions
- Who can see it. Admin users need the DSP Partners Analytics admin permission — a role
holding only DSP Partners does not see it, and opening its URL shows Record not found.
Account users see it as the RTB → DSP Partners Analytics sub-tab, and the REST endpoint
GET /rest-api/rtb/dsp-analytics/search.doanswers, once their role has the DSP Partners Analytics permission set to Enabled (Read-only opens nothing). On its own it is read-only — it does not let the person change a partner. - Deleting a partner breaks the revenue link. Deletion clears the endpoint reference from
every creative that pointed at it, so the partner’s past Impressions and Revenue fall out of
this grid while its Requests, Bids and Wins stay behind under
id(Deleted). Invoice a partner before you delete it, or deactivate instead — Active off stops delivery and keeps the whole history (Retire or delete a partner). - A CPC or CPI partner’s Revenue follows its model. A partner set to CPC is billed on clicks, so its impressions carry no gross; check the model matches how the partner actually pays before comparing gross with the partner’s figures. A CPC partner without Wrap click-through records no clicks at all — see the partner caveats.
- Header-bidding quotes are not Requests. A partner asked for a header-bidding slot is quoting a price; those calls are not in this funnel.
- Analytics sync (Epom WL DSP) rewrites the day. With Money synced, the sync matches a day’s gross to the total the partner’s report gives for the whole day, not to the sum of its per-country rows; rows it cannot attach to one of your placements and creatives are never written, so the day can stay below the partner’s total — details in the reference.
- QPS in the partners grid is measured, not this page. The partners list’s QPS column is the observed requests-per-second the ad servers write back about once a minute; this page counts requests per day.
Not working?
| Symptom | Likely cause | Check |
|---|---|---|
| The page is missing, or the URL shows Record not found. | Your admin role lacks DSP Partners Analytics; an account role has it unset or Read-only | Users and roles |
| Requests are 0 for a partner | It is inactive, blocked by Max QPS = 0, or no OpenRTB banner points at it on a placement with traffic; or SSP bidding optimization suppresses it on that placement/country | Partner form → Active, Max QPS; the banner’s placements; SSP bidding optimization |
| Requests high, Bids 0 | Not bidding, or every bid rejected: below floor, unpriceable currency, several seats, malformed | Floors; a troubleshooting log task; the partner’s logs |
| Bids high, Wins low | Losing the auction to other demand | Compare bid prices with the winners’ |
| Wins above Impressions | Creatives that did not render, or were dropped after the auction (scan, empty markup) | Expected; see the creative-scan console |
| Revenue is 0 with Impressions | The partner’s Pricing model is CPC and no clicks are counted — Wrap click-through off, or native/video creatives | Partner form → Pricing model, Wrap click-through |
| Revenue is far below the partner’s figure | Pricing model mismatch, or a deleted partner lost its creative links | Partner form; invoice before deleting |
| eCPM reads 0 | No impressions yet for that row | Wait for delivery |
| The CSV has fewer columns than expected | Only grouped dimensions become columns | Group by them before exporting |
| A deleted partner shows as id (Deleted) with no revenue | The deletion cleared the creative links | Nothing to recover from this page; use the standard report’s Gross for those creatives |
Reference
| Column | Meaning |
|---|---|
| Requests | Bid requests sent to the endpoint (header-bidding quotes excluded). |
| Bids | Responses with one valid, priced bid at or above the floor (deal bids exempt). |
| Wins | Auctions won with a price and non-empty markup. |
| Impressions / Clicks | From the delivery log, through the banner that served. |
| Revenue | What the partner was billed for delivery it won, by its pricing model. |
| eCPM | The row’s Revenue ÷ its Impressions × 1000; 0 until it has served. |
| Permission | Where | Lets you |
|---|---|---|
| DSP Partners Analytics (Admin UI) | Admin role | Open Admin → Demand partners (DSP) → DSP partners analytics. |
| DSP Partners Analytics (RTB Management), Enabled | Network role | See the RTB → DSP partners analytics sub-tab and call GET /rest-api/rtb/dsp-analytics/search.do. |
Over the API, GET /rest-api/rtb/dsp-analytics/search.do answers the same rows; for invoicing
pulls see DSP endpoint traffic and spend.
