
Read the Traffic Quality cards, rows and Details
Open the Traffic Quality page, read the six summary cards, filter by date and status, read each placement's row and open Details for its confidence, likely range, split, facts, Why and What to do.
The Traffic Quality page gives each placement one figure per day — the share of its impressions that are invalid — with what was paid for them, a status that says whether to act, and the reasons in plain words. This page walks the screen: the six summary cards, the Date and Status filters, each placement’s row, and the Details panel that shows the whole picture of a placement-day. What the statuses mean and what to do about them is on Read the Traffic Quality report.
Example. Yesterday the Sports Daily › sidebar › 300×250 placement received 41,000 impressions; 34 % of them carry a strong invalid signal (likely 31 %–37 %, High confidence), far above the 10 % Act line for web placements, so the row reads Act. Paid for invalid says $41.20 of the day’s $132.80 gross went to invalid impressions; Main reasons are Counted twice 19 %, Data-centre servers 11 % and Declared bots and crawlers 6 %.
Typical scenarios
| You want | Do | Where |
|---|---|---|
| See which placements need attention today | Open the page: the Status filter is on Act + Watch and the list comes worst first | Account → Traffic Quality |
| Know whether a publisher’s 34 % is unusual | Read network median on the row and Your network today in Details | The row; Details |
| Decide whether a placement’s bad day is a trend | Read the arrow on the row (up from 14 %) and Last 7 days in Details | The row; Details |
Step by step
-
Go to Account → Traffic Quality. The tab needs Traffic Quality Tab Visible and Traffic Quality Reports on your role, and the feature switched on for the network (ask Epom support or your account manager — it is off by default and has no in-product switch).
-
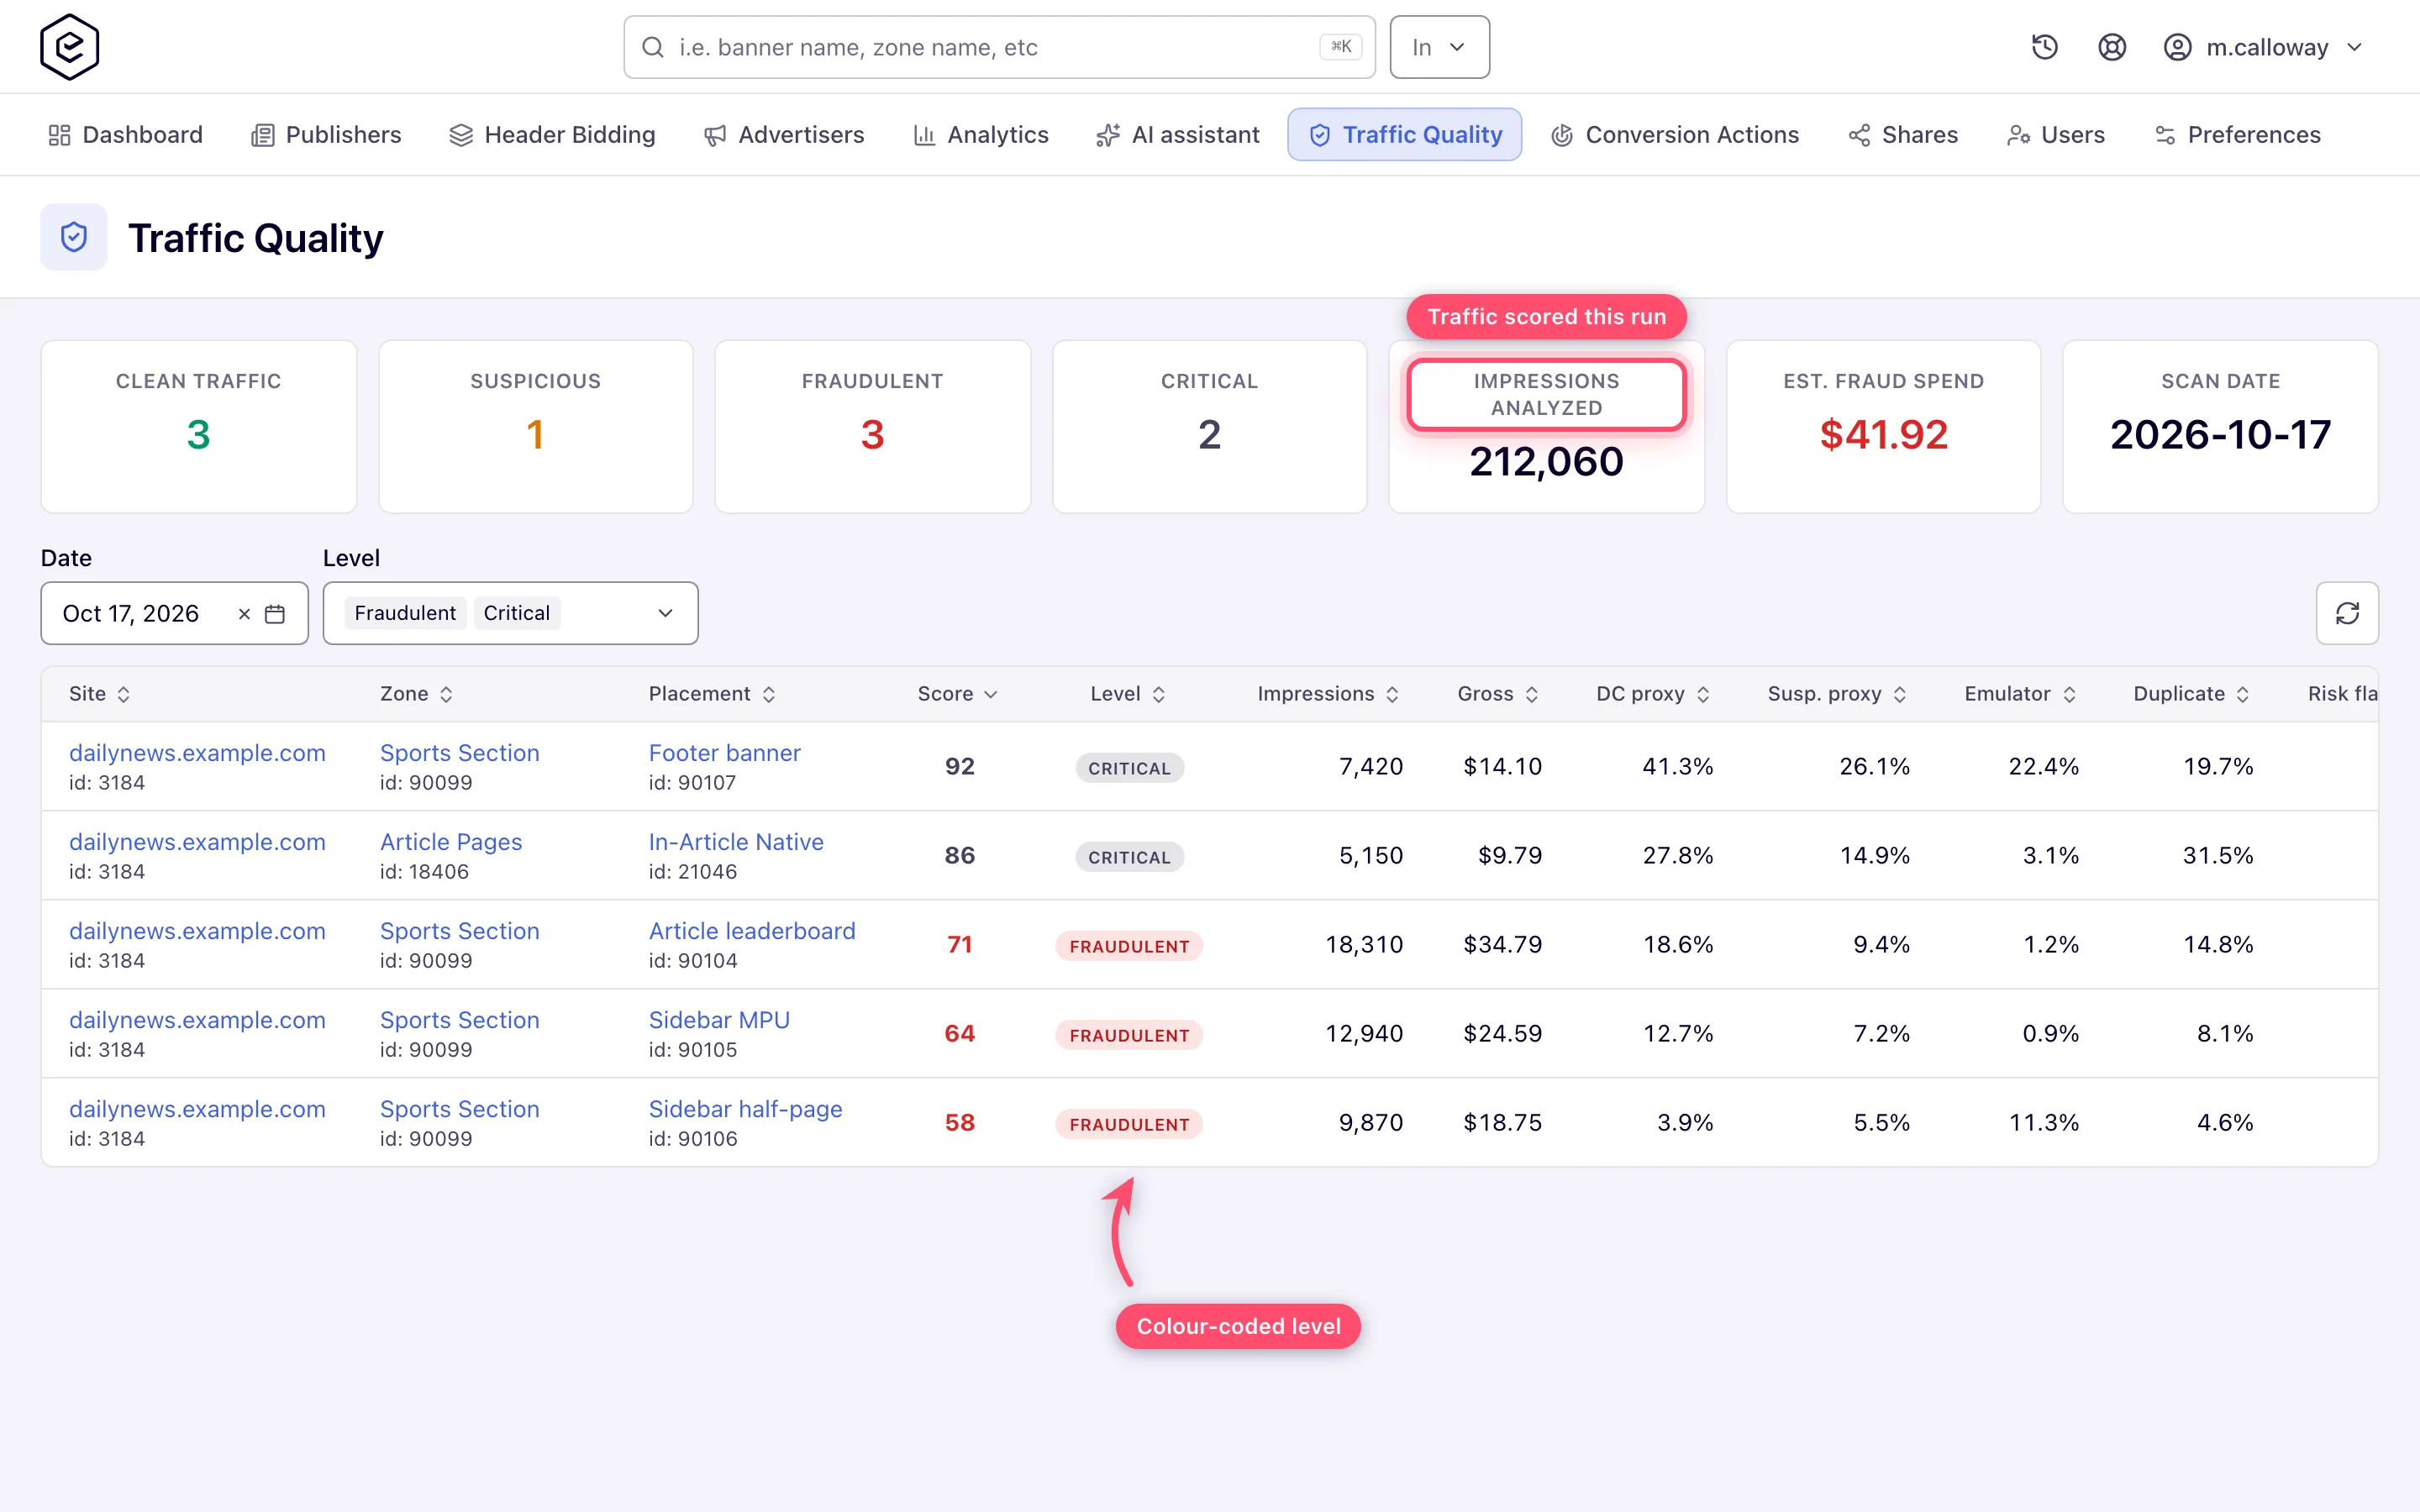
Read the six cards. They summarise the selected scan date for every placement you may see and ignore the Status filter:
- Invalid traffic — the share of all the impressions received that are invalid, with N of M impressions under it. A day scored before release 155 shows a dash: it has no exact share.
- Paid for invalid — what was paid for those invalid impressions, out of the day’s counted gross (of $X gross). It is an exact sum, not an estimate.
- Refused before counting — impressions a validation check refused. They cost nothing: a refused impression is never billed, so it never adds to Paid for invalid.
- To act on and To watch — how many placements have the Act and the Watch status.
- Scan date.
-
Filter by Date — it defaults to yesterday and will not accept a date after today — and by Status, a multi-select that defaults to Act + Watch so the placements that need you are the ones listed. Tick OK and Not enough data to see the rest.
-
Read the rows. Each is one placement on that day; the list comes worst first — Act, then Watch, OK and Not enough data, each by its invalid share — and a header click sorts the loaded rows.
- Placement — the placement’s name links to it; the site › zone and the id are underneath.
- Status — Act, Watch, OK or Not enough data; hover it for one line on why. See Traffic Quality statuses.
- Invalid traffic — the share of the impressions received that carry at least one strong invalid-traffic signal or were counted a second time. A small meter sets it against the Watch and Act lines for the placement’s format; an arrow (up from 14%, down from 9%) appears when the placement’s last 7 days differ by a percentage point or more; and network median is the median share among the network’s placements of the same format that day. A Not enough data row says how many impressions came from how few people instead.
- Paid for invalid — what was paid for the invalid impressions, of the placement’s counted gross.
- Main reasons — the three largest reasons, in plain words, each with its share of the impressions received. One impression can carry several reasons, so they need not add up to the invalid share.
- Report — Details, and Generate report or Download PDF.
-
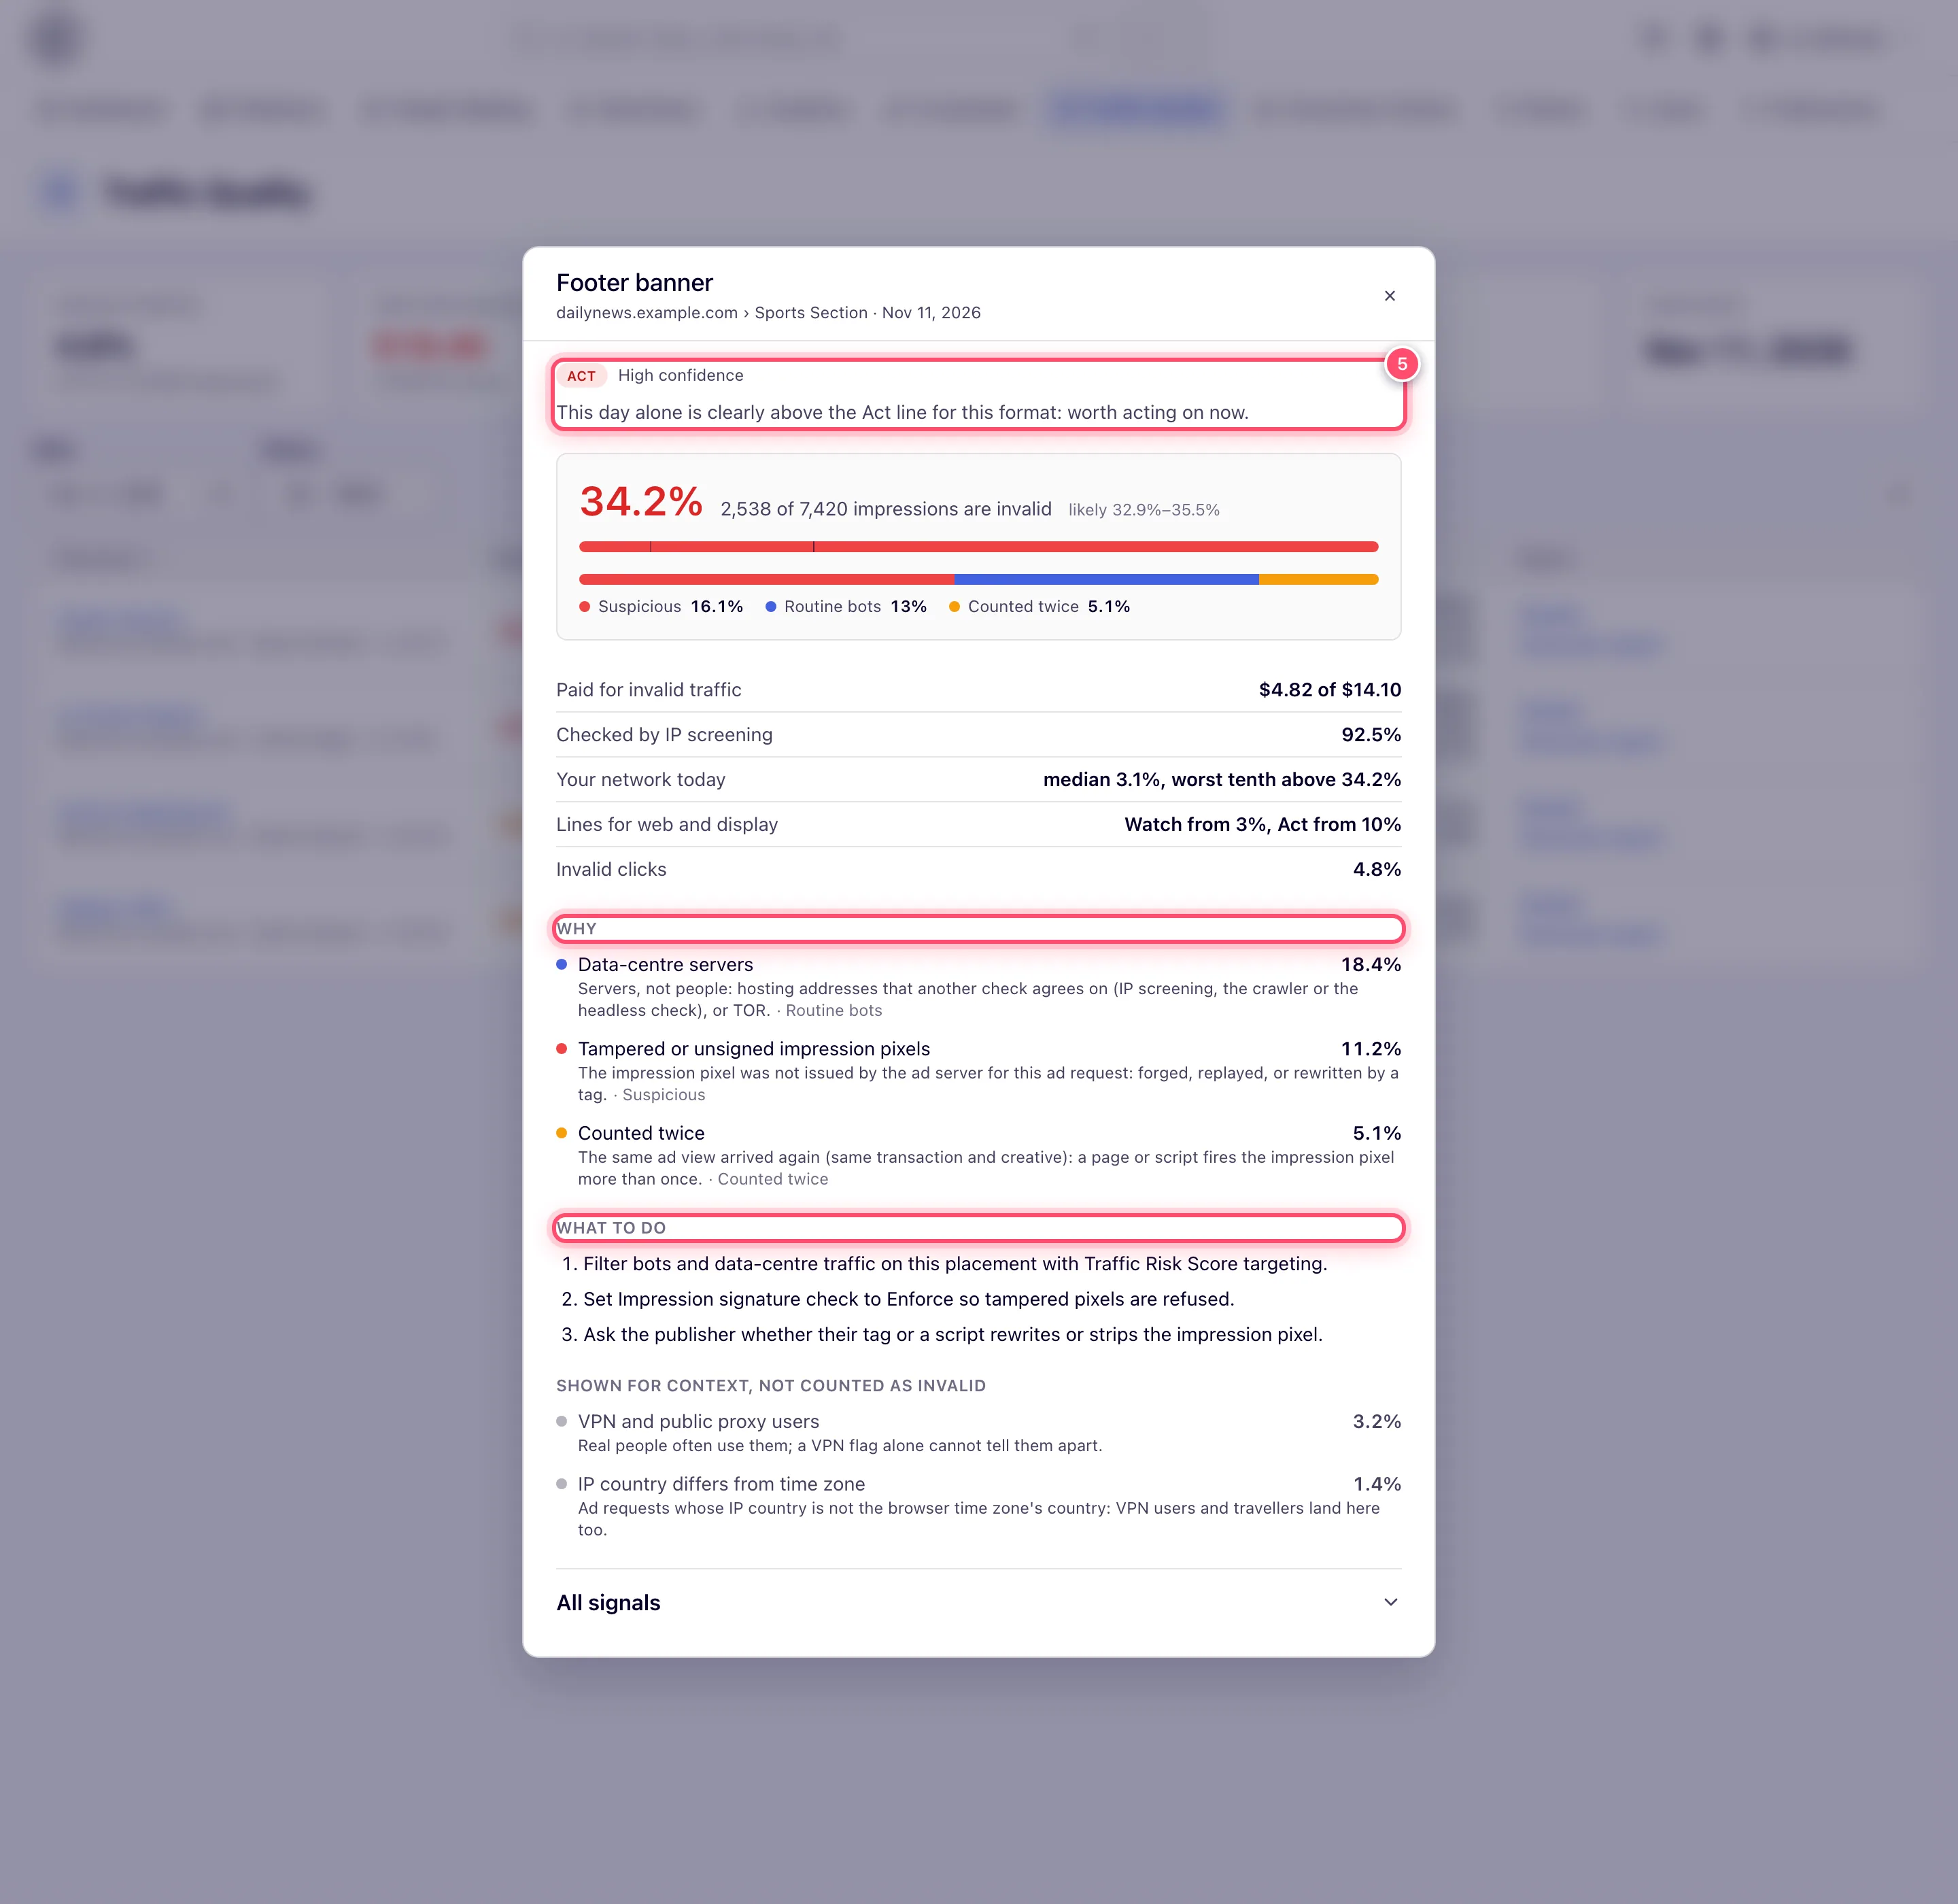
Click Details for the whole picture of the placement-day:
- the status with its one-line hint, and how far the figure can be trusted — High, Medium or Low confidence;
- the invalid share in large type, N of M impressions are invalid, and its likely range (likely 31%–37%);
- a bar splitting the invalid share into Suspicious, Routine bots and Counted twice — each invalid impression sits in exactly one of the three, so they add up to the share;
- the facts: Paid for invalid traffic ($41.20 of $132.80), Refused before counting, Checked by IP screening (the share of the impressions the risk-scoring service scored), Your network today (the median and the edge of the worst tenth among the network’s placements of the same format), Last 7 days (the placement’s invalid share over the seven days before), the lines for its format (Watch from 3%, Act from 10%) and Invalid clicks;
- Why — every strong reason with a one-line explanation;
- What to do — up to three fixed actions for the largest reasons (see What to do);
- Shown for context, not counted as invalid — signals worth knowing that do not make an impression invalid on their own, such as VPN users or late impression pixels. Each share counts only the impressions the invalid share leaves valid, so no impression is in both (the IP country check is a share of ad requests);
- All signals, collapsed — the raw shares behind the verdict: DC proxy, Susp. proxy, crawler, headless, emulator, duplicate, risk flagged and geo mismatch.
For evidence you can send the publisher, continue with Generate the Traffic Quality PDF report.
Caveats and exceptions
The cards ignore the Status filter; the grid does not. The six cards summarise every placement you may see on the scan date, while the grid lists only the statuses ticked — Act + Watch by default — so cards with numbers above an empty grid mean every placement was OK or Not enough data.
The caveats that apply to every Traffic Quality figure — evidence, not enforcement; one day at a time; how repeats and refused impressions are counted; reconciling with the Advanced report — are on Read the Traffic Quality report.
Not working?
The page only reads what the nightly run saved. The full list of causes for zeros or an empty grid is on Read the Traffic Quality report; the two that are about this screen itself:
| Symptom | Check | Where |
|---|---|---|
| Cards show numbers above an empty grid | Every placement was OK or Not enough data; the grid shows only Act + Watch by default. Tick the other two statuses. That is the good outcome, not a broken page. | The Status filter |
| The Invalid traffic card shows a dash | The day was scored before release 155 and has no exact share; its rows show the old estimate (≈ 37.6% (estimate)). | The Date filter |
Reference
What each status asks of you, the Watch and Act lines per placement format, and the fixed What to do list are on the hub: Traffic Quality statuses and What to do. What each reason means: Traffic Quality reasons.
