
Read the publisher and advertiser dashboards
The fixed dashboards a publisher or advertiser lands on — set the period once, read the KPI row with sparklines, switch the Trends chart between metrics, compare with the previous period and drill down the breakdown tree.
A publisher or advertiser lands on a fixed role dashboard: KPI tiles, a Trends chart and a breakdown tree, all on one period picked in the header. The publisher side reports payout, the advertiser side charges, and nothing on it is configured — it reads. Which dashboard a role lands on, and the network manager’s widget board, are on Dashboards.
Example. Harbour Publishing’s editor opens the dashboard on Last 7 days with Compare with previous period ticked: Revenue 1,820 USD, up 9 % on the week before, the Trends card by day with last week’s dashed baseline underneath, and the Publisher/Zone/Placement tree showing the homepage leaderboard as the top earner.
Typical scenarios
| You want | Do | Where |
|---|---|---|
| A publisher’s last-7-days payout against the week before | period Last 7 days, tick Compare with previous period | the period control in the header |
| Today’s traffic by hour | period Today — the Trends card charts a single day by hour | the Trends card |
| Which placement earns most this month | period Current month, read the breakdown tree | the breakdown tree, sorted by revenue |
Step by step
Reading the role dashboards
-
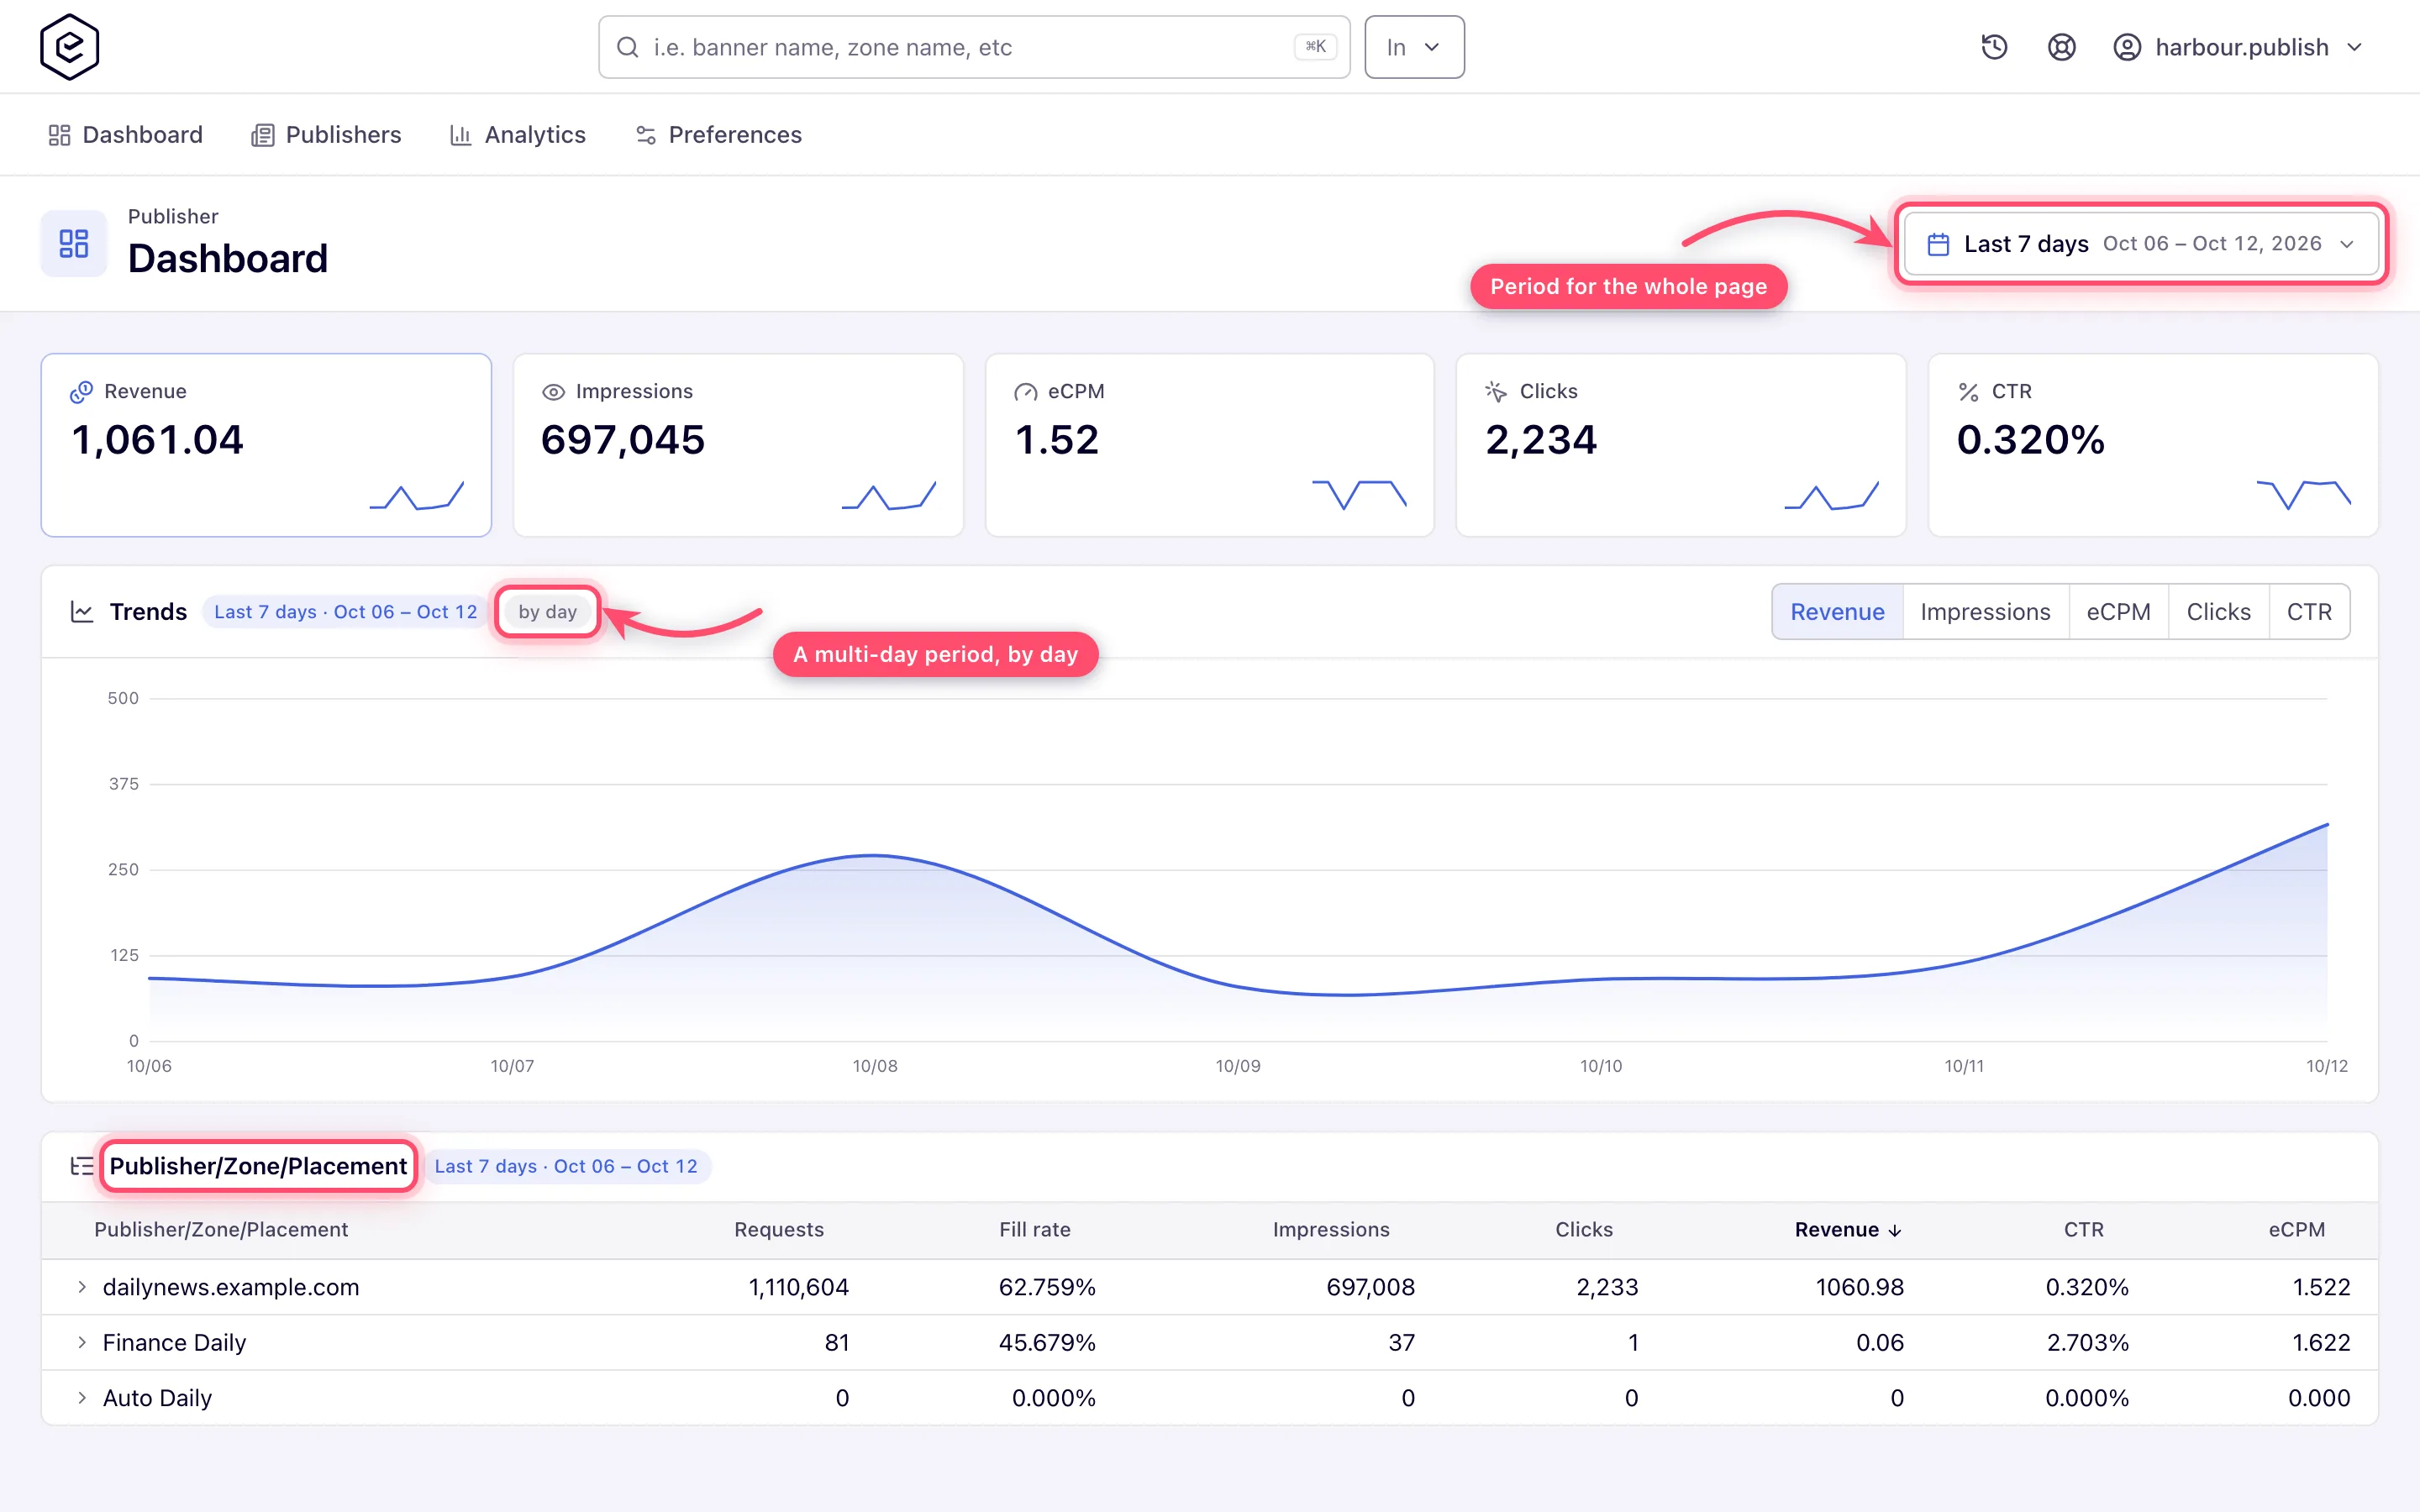
Set the window once in the period control in the page header. The KPI row, the chart and the tree all report it, and each card repeats it as a pill so a single card still says which dates it covers. The list carries all fourteen ranges; a range you cannot report on stays in the list, greyed out with a padlock, rather than vanishing.
-
Read the KPI row: the window’s total for each metric — Revenue, Impressions, eCPM, Clicks and CTR on the publisher side; Charges instead of Revenue on the advertiser side; Viewable impressions, vCPM and Viewable CTR on a role granted them (how a role reads on viewable impressions) — each with a sparkline of the shape within the window.
-
Switch the Trends card between metrics with the segmented control. The step follows the window and is written on the card: a single-day window is charted by hour, anything longer by day. On Today a dashed now rule marks how far the day has run, so the curve flattening to zero after it does not read as a traffic collapse.
-
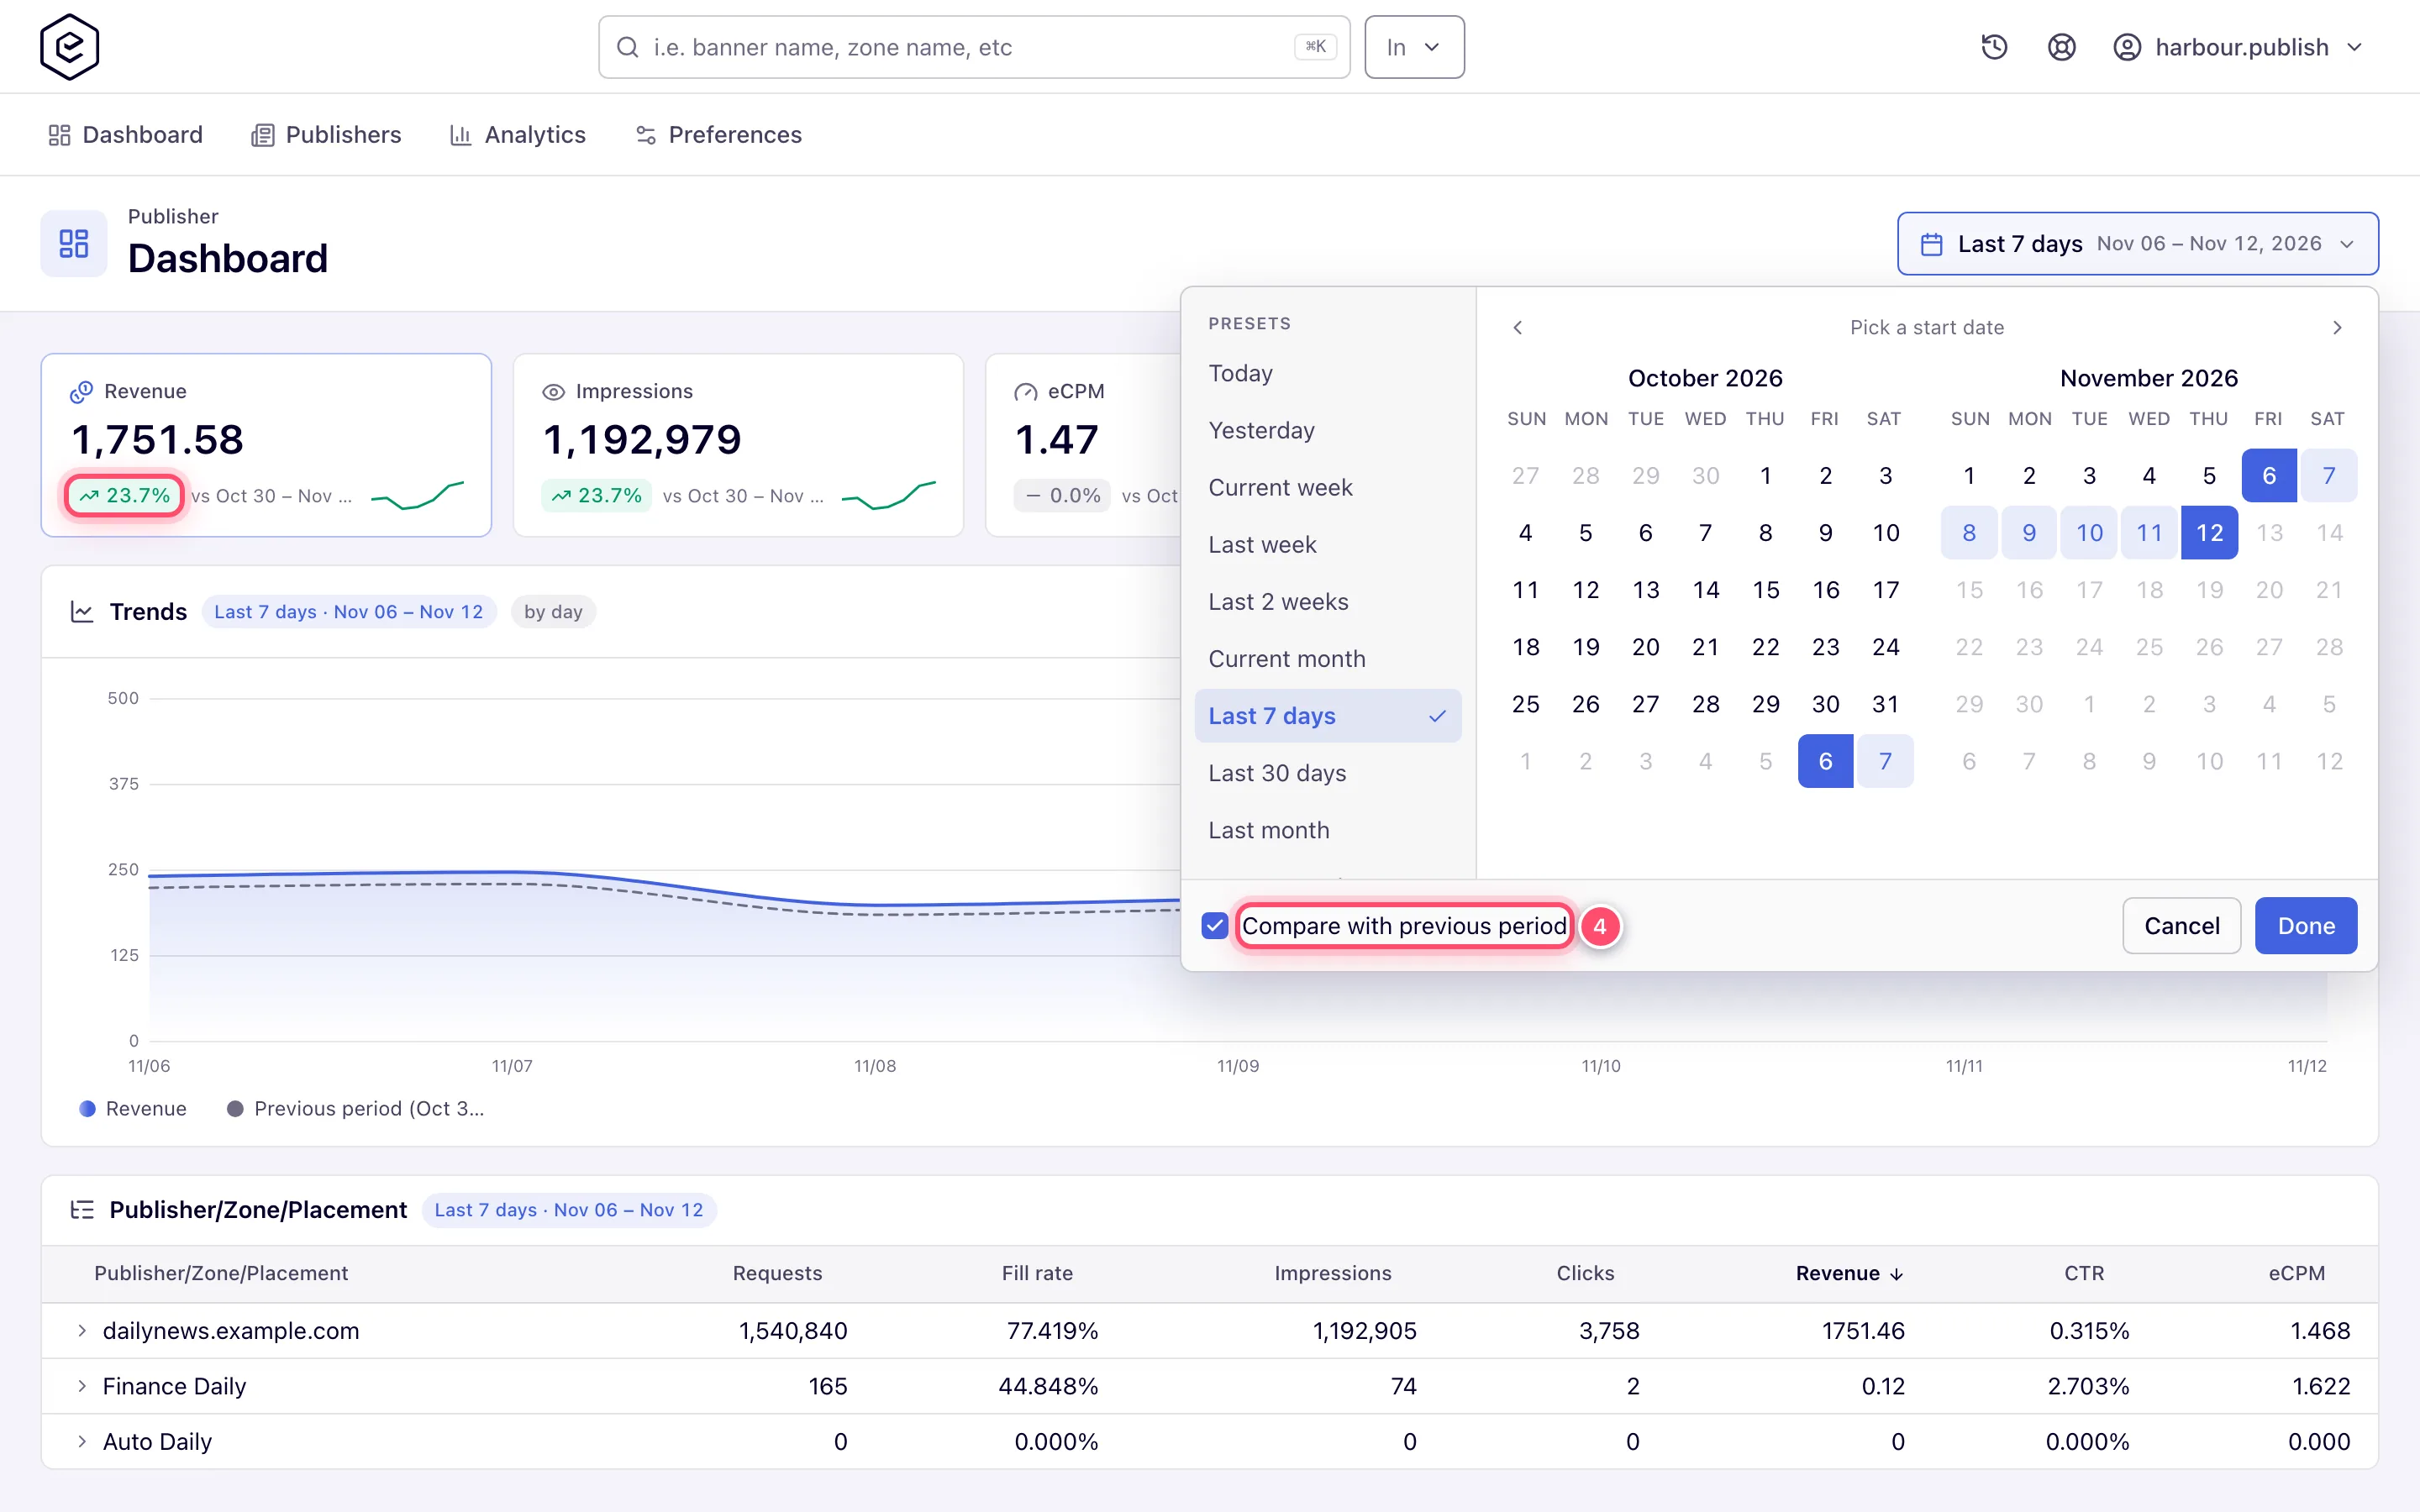
Tick Compare with previous period in the picker to add the preceding window of equal length: a dashed baseline on the chart, and a change chip on each tile captioned with the dates it is measured against.
-
Drill down in the breakdown tree — Publisher/Zone/Placement, or Advertiser/Campaign/Banner — through the same window. It is sorted by revenue (charges on the advertiser side), highest first.
Caveats and exceptions
The advertiser tree needs the tree-style UI. The breakdown tree on the advertiser dashboard renders only for accounts on the tree-style UI preference. Grid-style accounts get the KPI row and the trends chart without the tree. The publisher dashboard’s tree has no such condition.
The now rule is a clock, not a data boundary. It marks the current hour of the network’s time zone — the clock the curve is plotted in — read when the page opens. Leave the page open past the hour and the rule stays where it was until you reload.
Hourly trends need the hourly permission. Charting a single day by hour needs the hourly-breakdown reporting permission. Without it a one-day window yields one point, and the Trends card says A single day has no daily trend — widen the period, or ask for hourly breakdown access rather than drawing a one-point line.
The caveats that apply to every dashboard — who lands where, no traffic, Period — are on Dashboards.
Not working?
| Symptom | Cause | Where to check / fix |
|---|---|---|
| No tree on the advertiser dashboard | The account is on the grid-style UI preference | the UI preference (tree-style) |
| A single day has no daily trend … on the Trends card | No hourly-breakdown reporting permission | the role’s reporting permissions; widen the period |
| The role dashboard opened on Today again | The window is remembered per browser, not per account | expected in a new browser / after clearing site data |
The rest of the list is on Dashboards.
Reference
The KPI tiles and tabs per role are in Role dashboards at a glance; how a role reads on viewable impressions is in the metrics reference.
