
Work the main widget dashboard
Add, fill, rearrange, refresh and delete widgets on the network manager's two-column dashboard, read the Totals strip, override every widget's range with Period, and add a widget straight from a report's Graph panel.
The main widget dashboard is the network manager’s configurable board: two columns of mini reports and charts, each widget with its own range, grouping and filters, plus a Period control in the header that looks at every widget on one window. Which dashboard you land on, and the publisher and advertiser dashboards, are on Dashboards.
Example. A network manager keeps four widgets: a Last 7 days line chart of Profit by day, a Yesterday pie of the top 10 countries by Profit, a Today table of Impressions and Revenue by Site, and a note with the week’s priorities. At 09:00 the board shows that yesterday’s profit (2,140 USD) is 12 % above the day before, that Germany replaced the UK as the second country, and that one site is already at 80 % of yesterday’s impressions.
Typical scenarios
| You want | Add | Settings |
|---|---|---|
| Yesterday’s top 10 countries by profit as slices | Pie chart | Metrics Profit, Range Yesterday, Group by Country |
| Profit trend for the last 7 days, one line per campaign | Line chart | Metrics Profit, Range Last 7 days, Group by Campaign, Breakdown by Day |
| Today’s revenue per site, refreshed as the day runs | Analytics table | Metrics Impressions, Revenue; Range Today; Group by Site |
| Impressions and clicks per hour for today side by side | Bar graph | Metrics Impressions, Clicks; Range Today; Breakdown by Hour |
| This month vs last month on every widget, just for a look | nothing — use Period in the header | pick Current month, then Last month; Widget default puts each widget back |
Step by step
The main widget dashboard
-
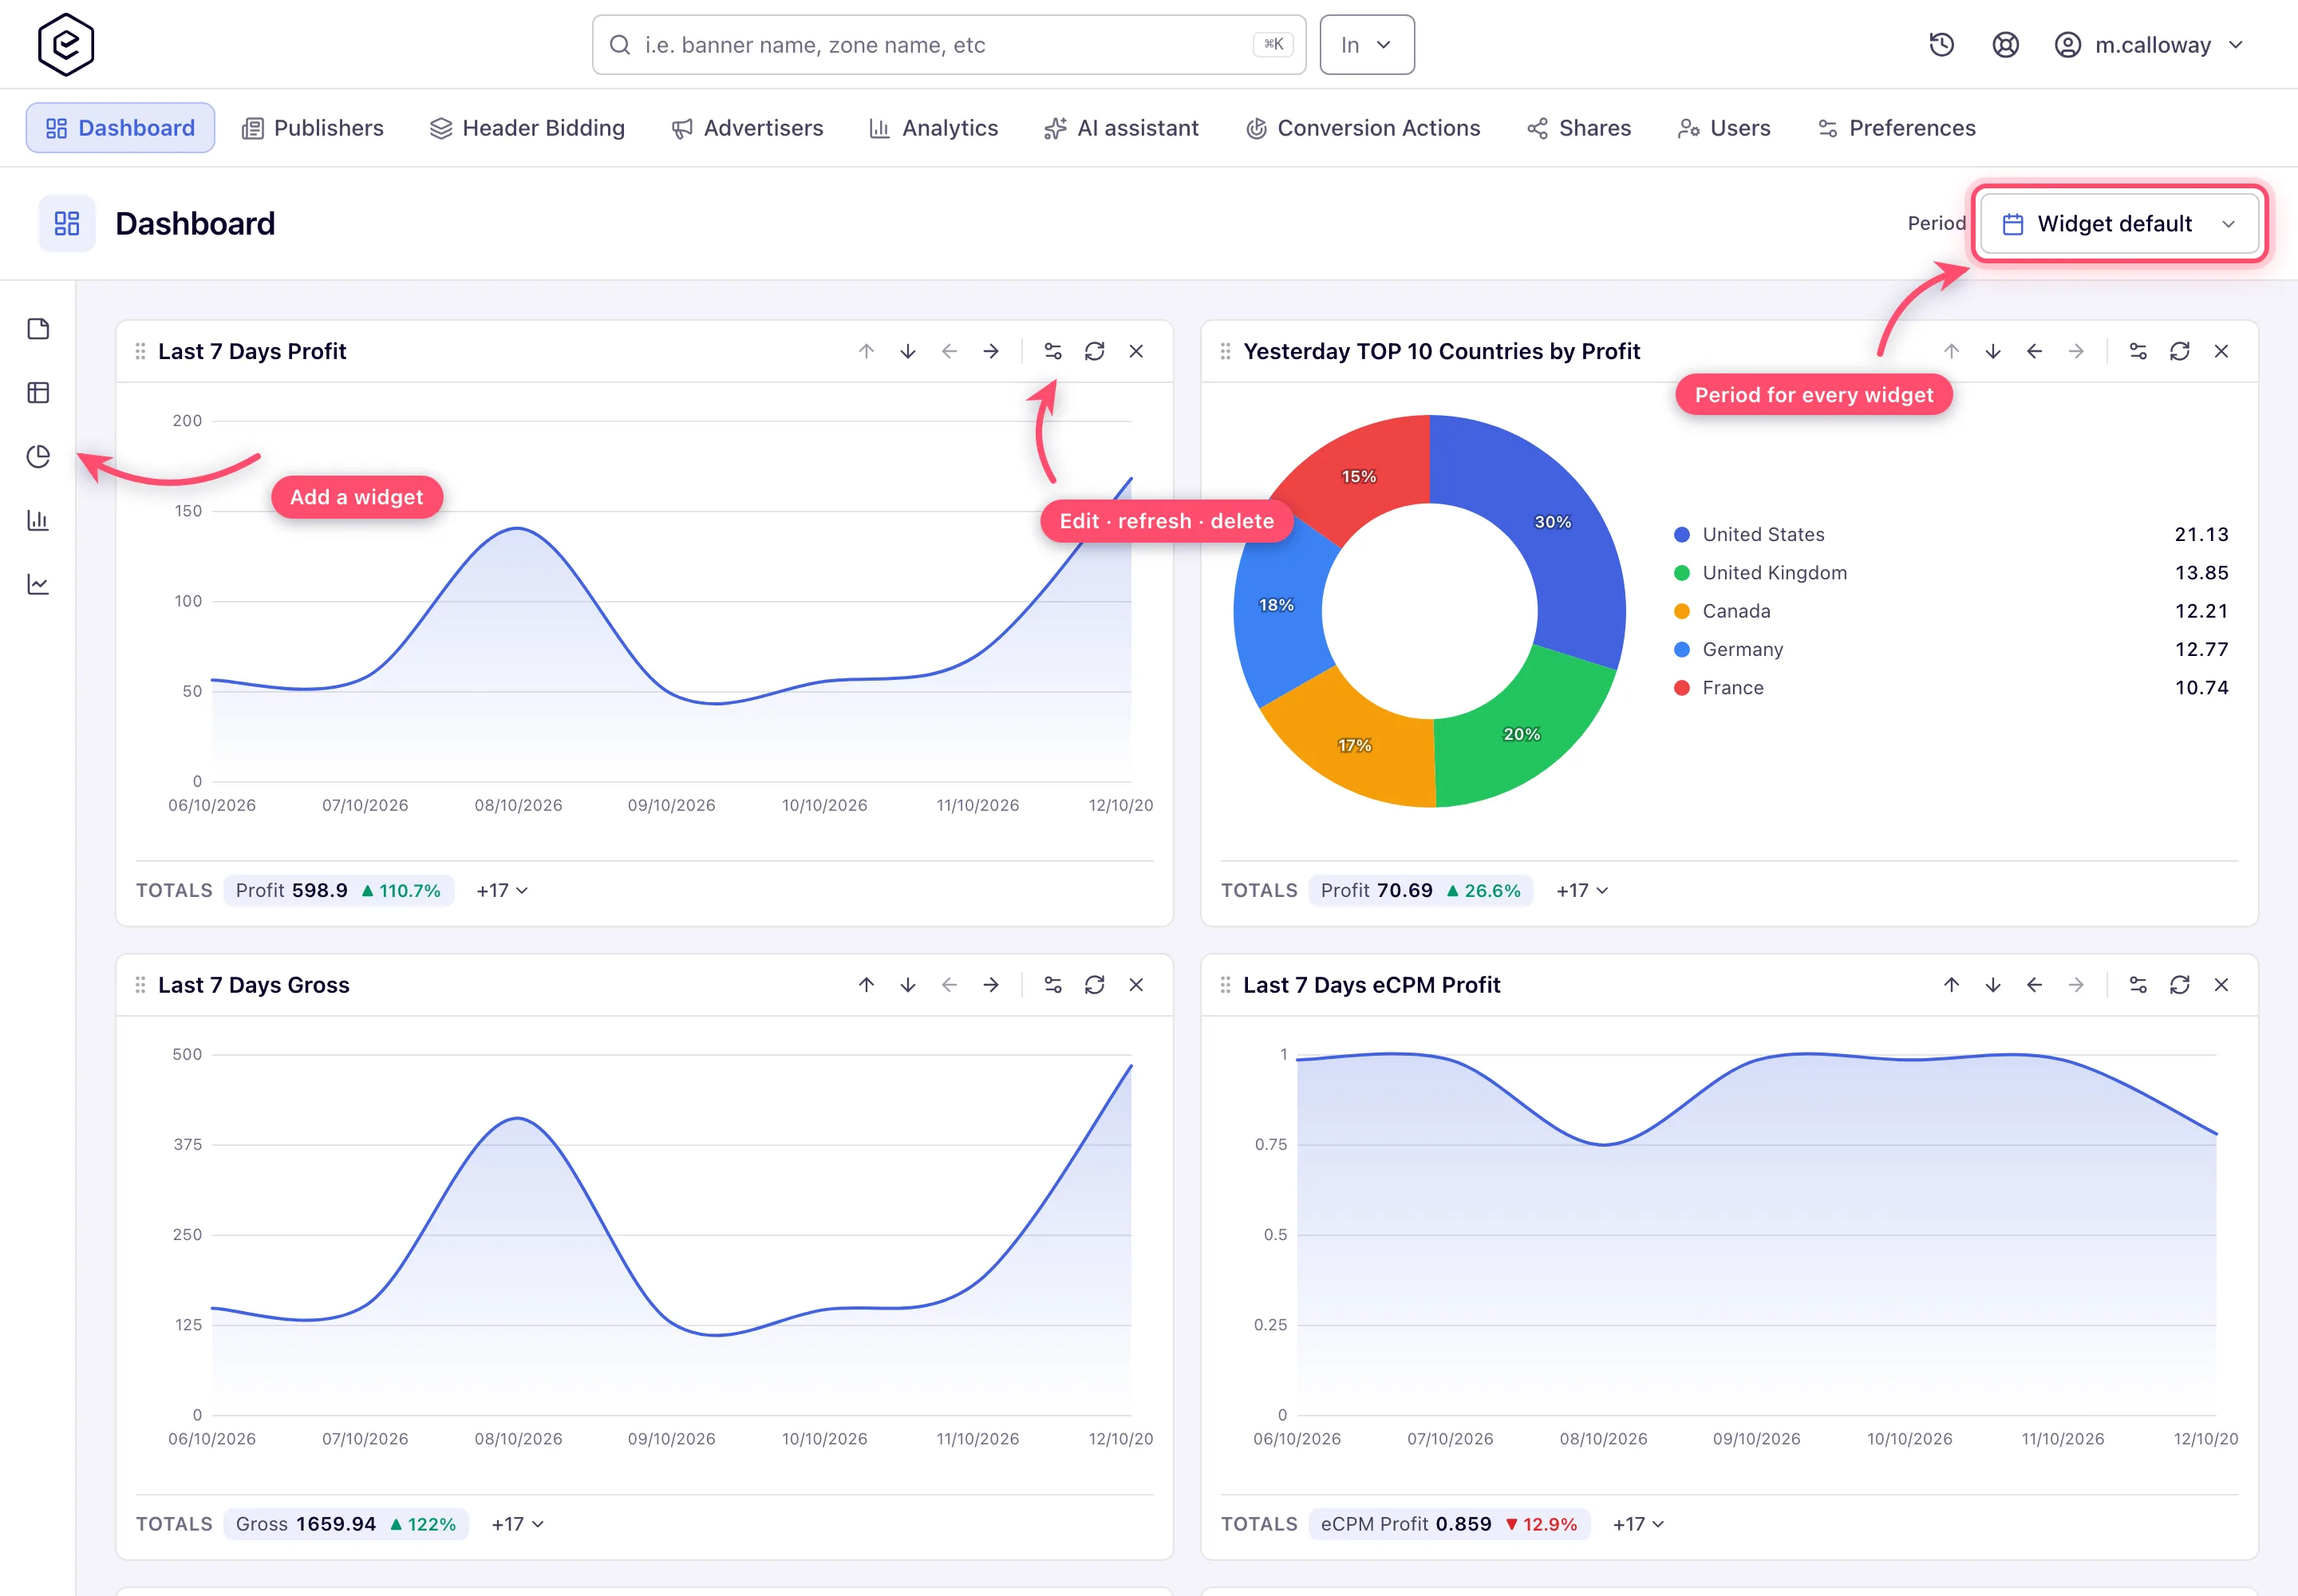
Go to Account → Dashboard. Your account was seeded with a starter set of widgets when it was created — up to ten, titled in your own language.
-
Add a widget from the icon rail down the left edge — Note, Analytics table, Pie chart, Bar graph or Line chart (what each draws: Widget types).
-
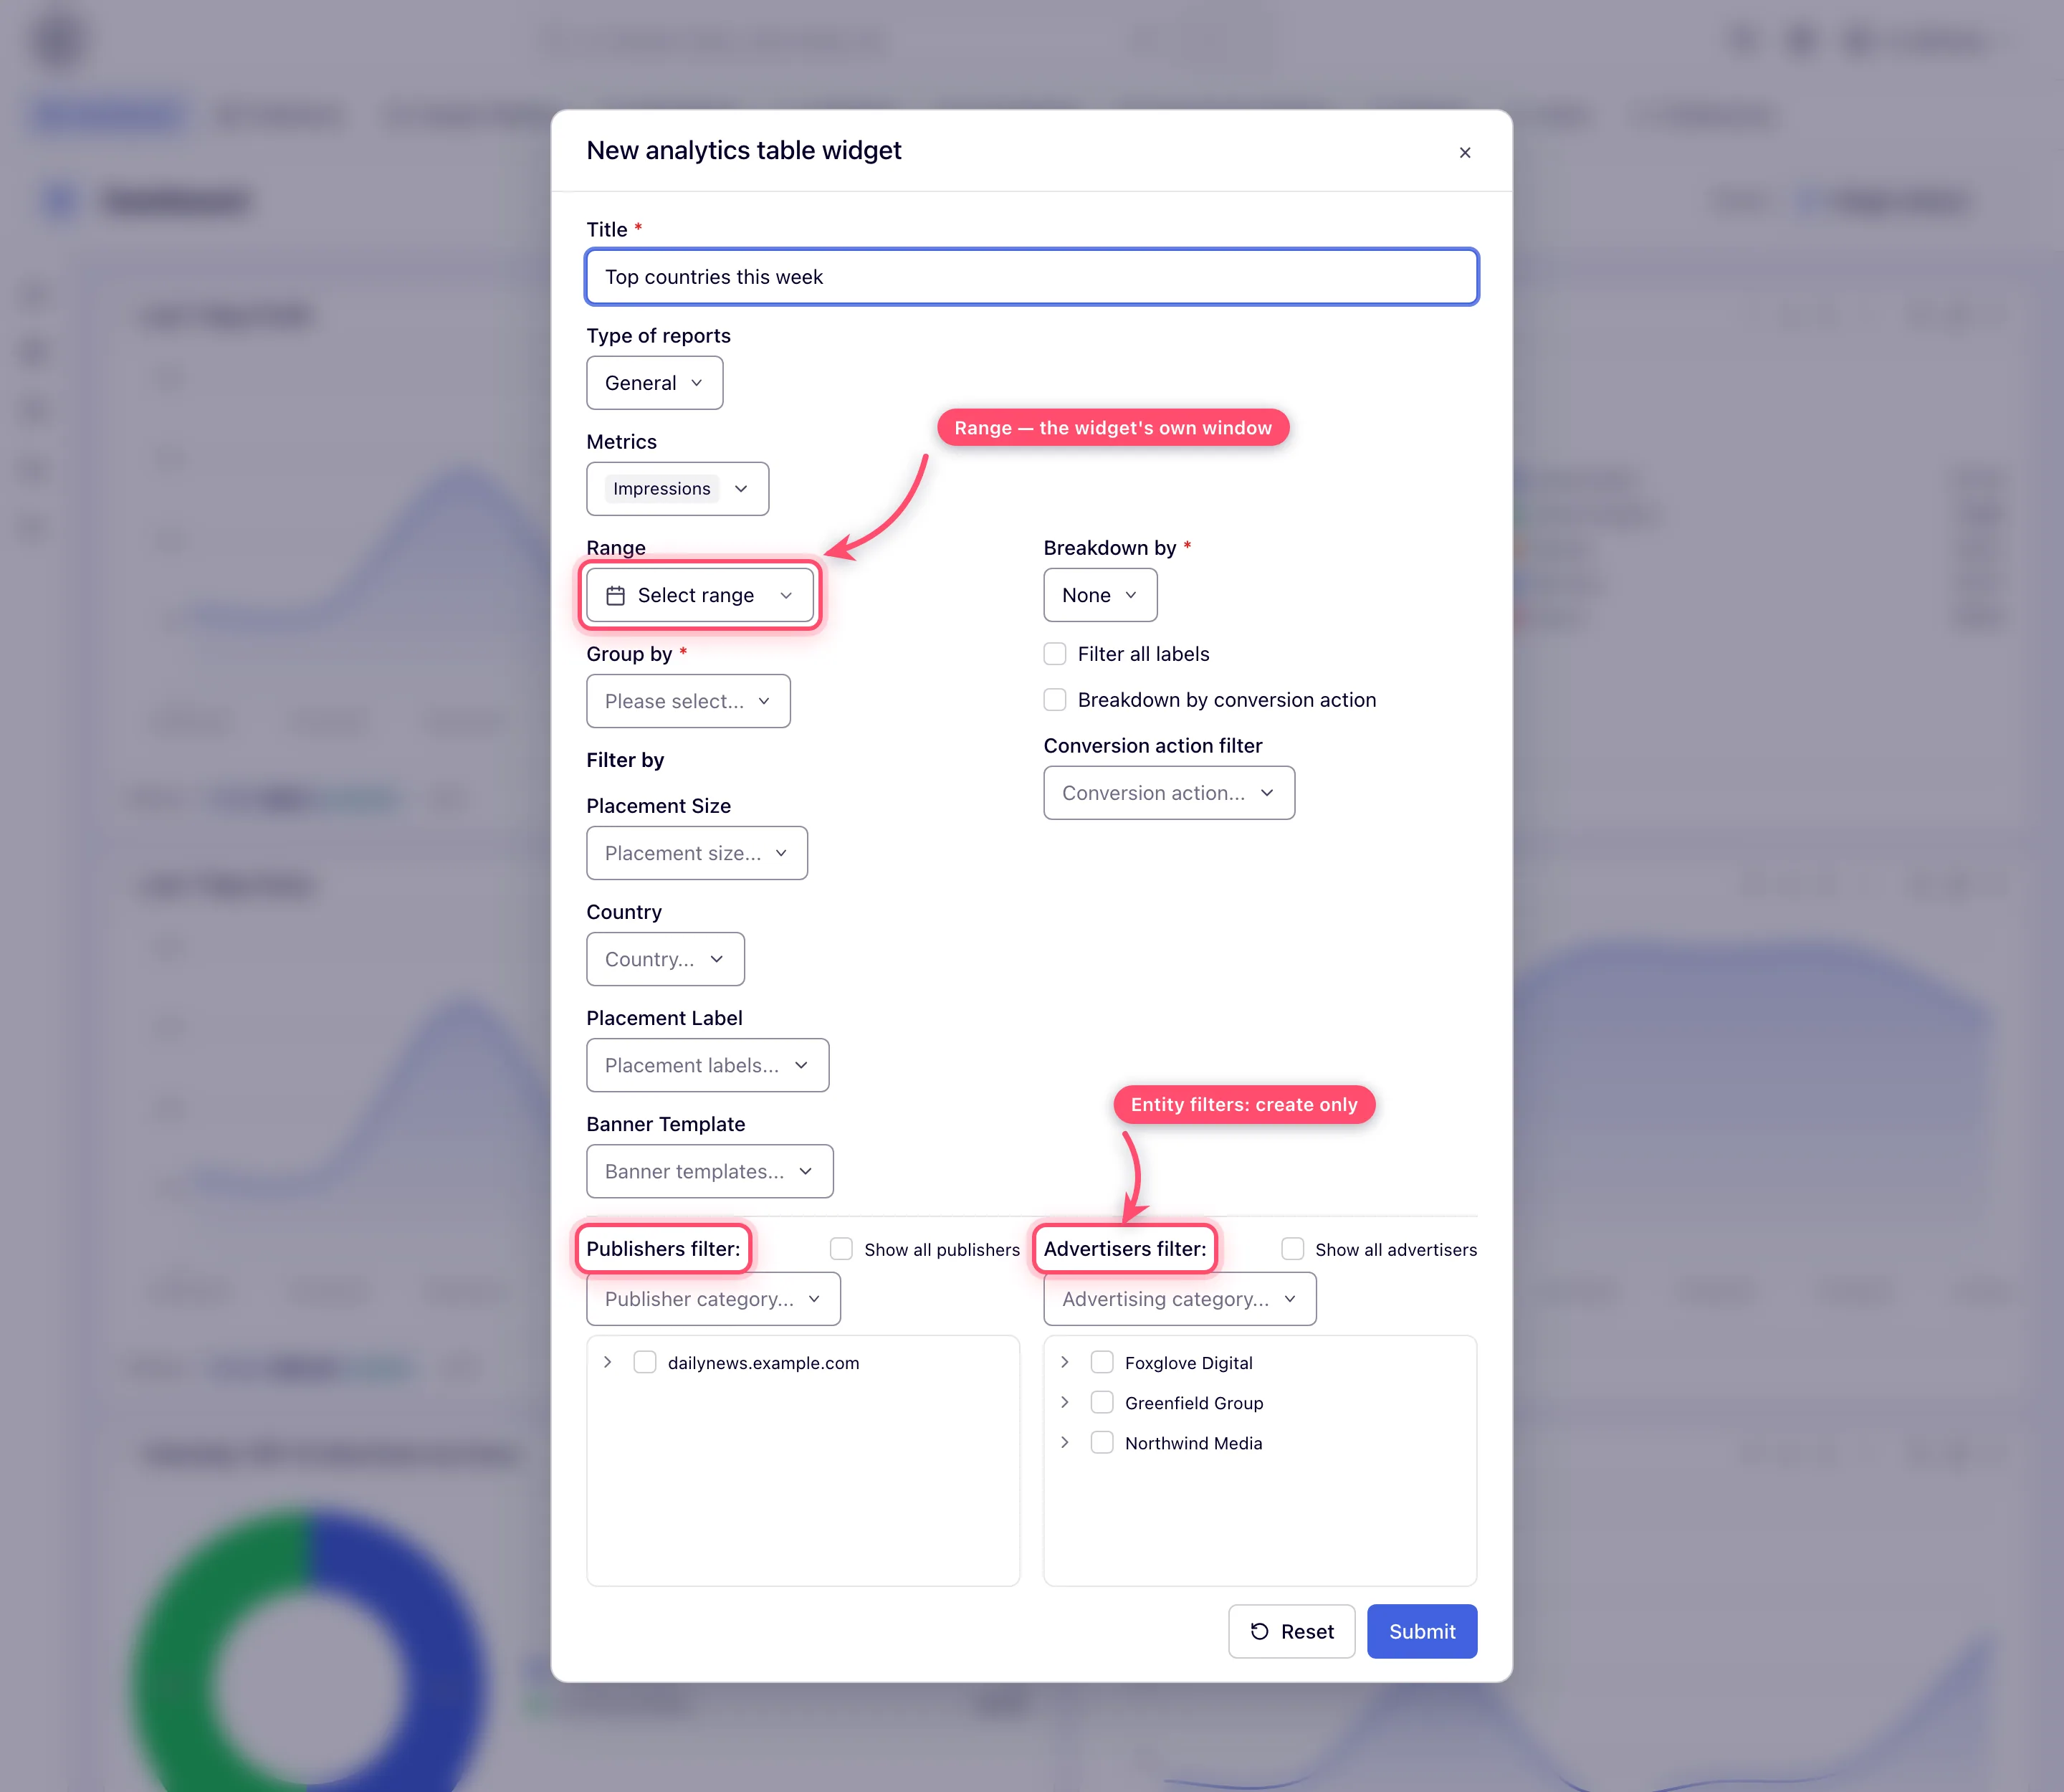
Fill the dialog (Options and fields): a Title, the Type of reports, the Metrics, a Range, a Group by and/or a Breakdown by, and any filters. Press Submit. Reset puts every field back to how the dialog opened; Submit stays greyed out until Title has something in it.
-
The new widget lands at the bottom of the shorter column — the left one when both columns hold the same number of cards.
-
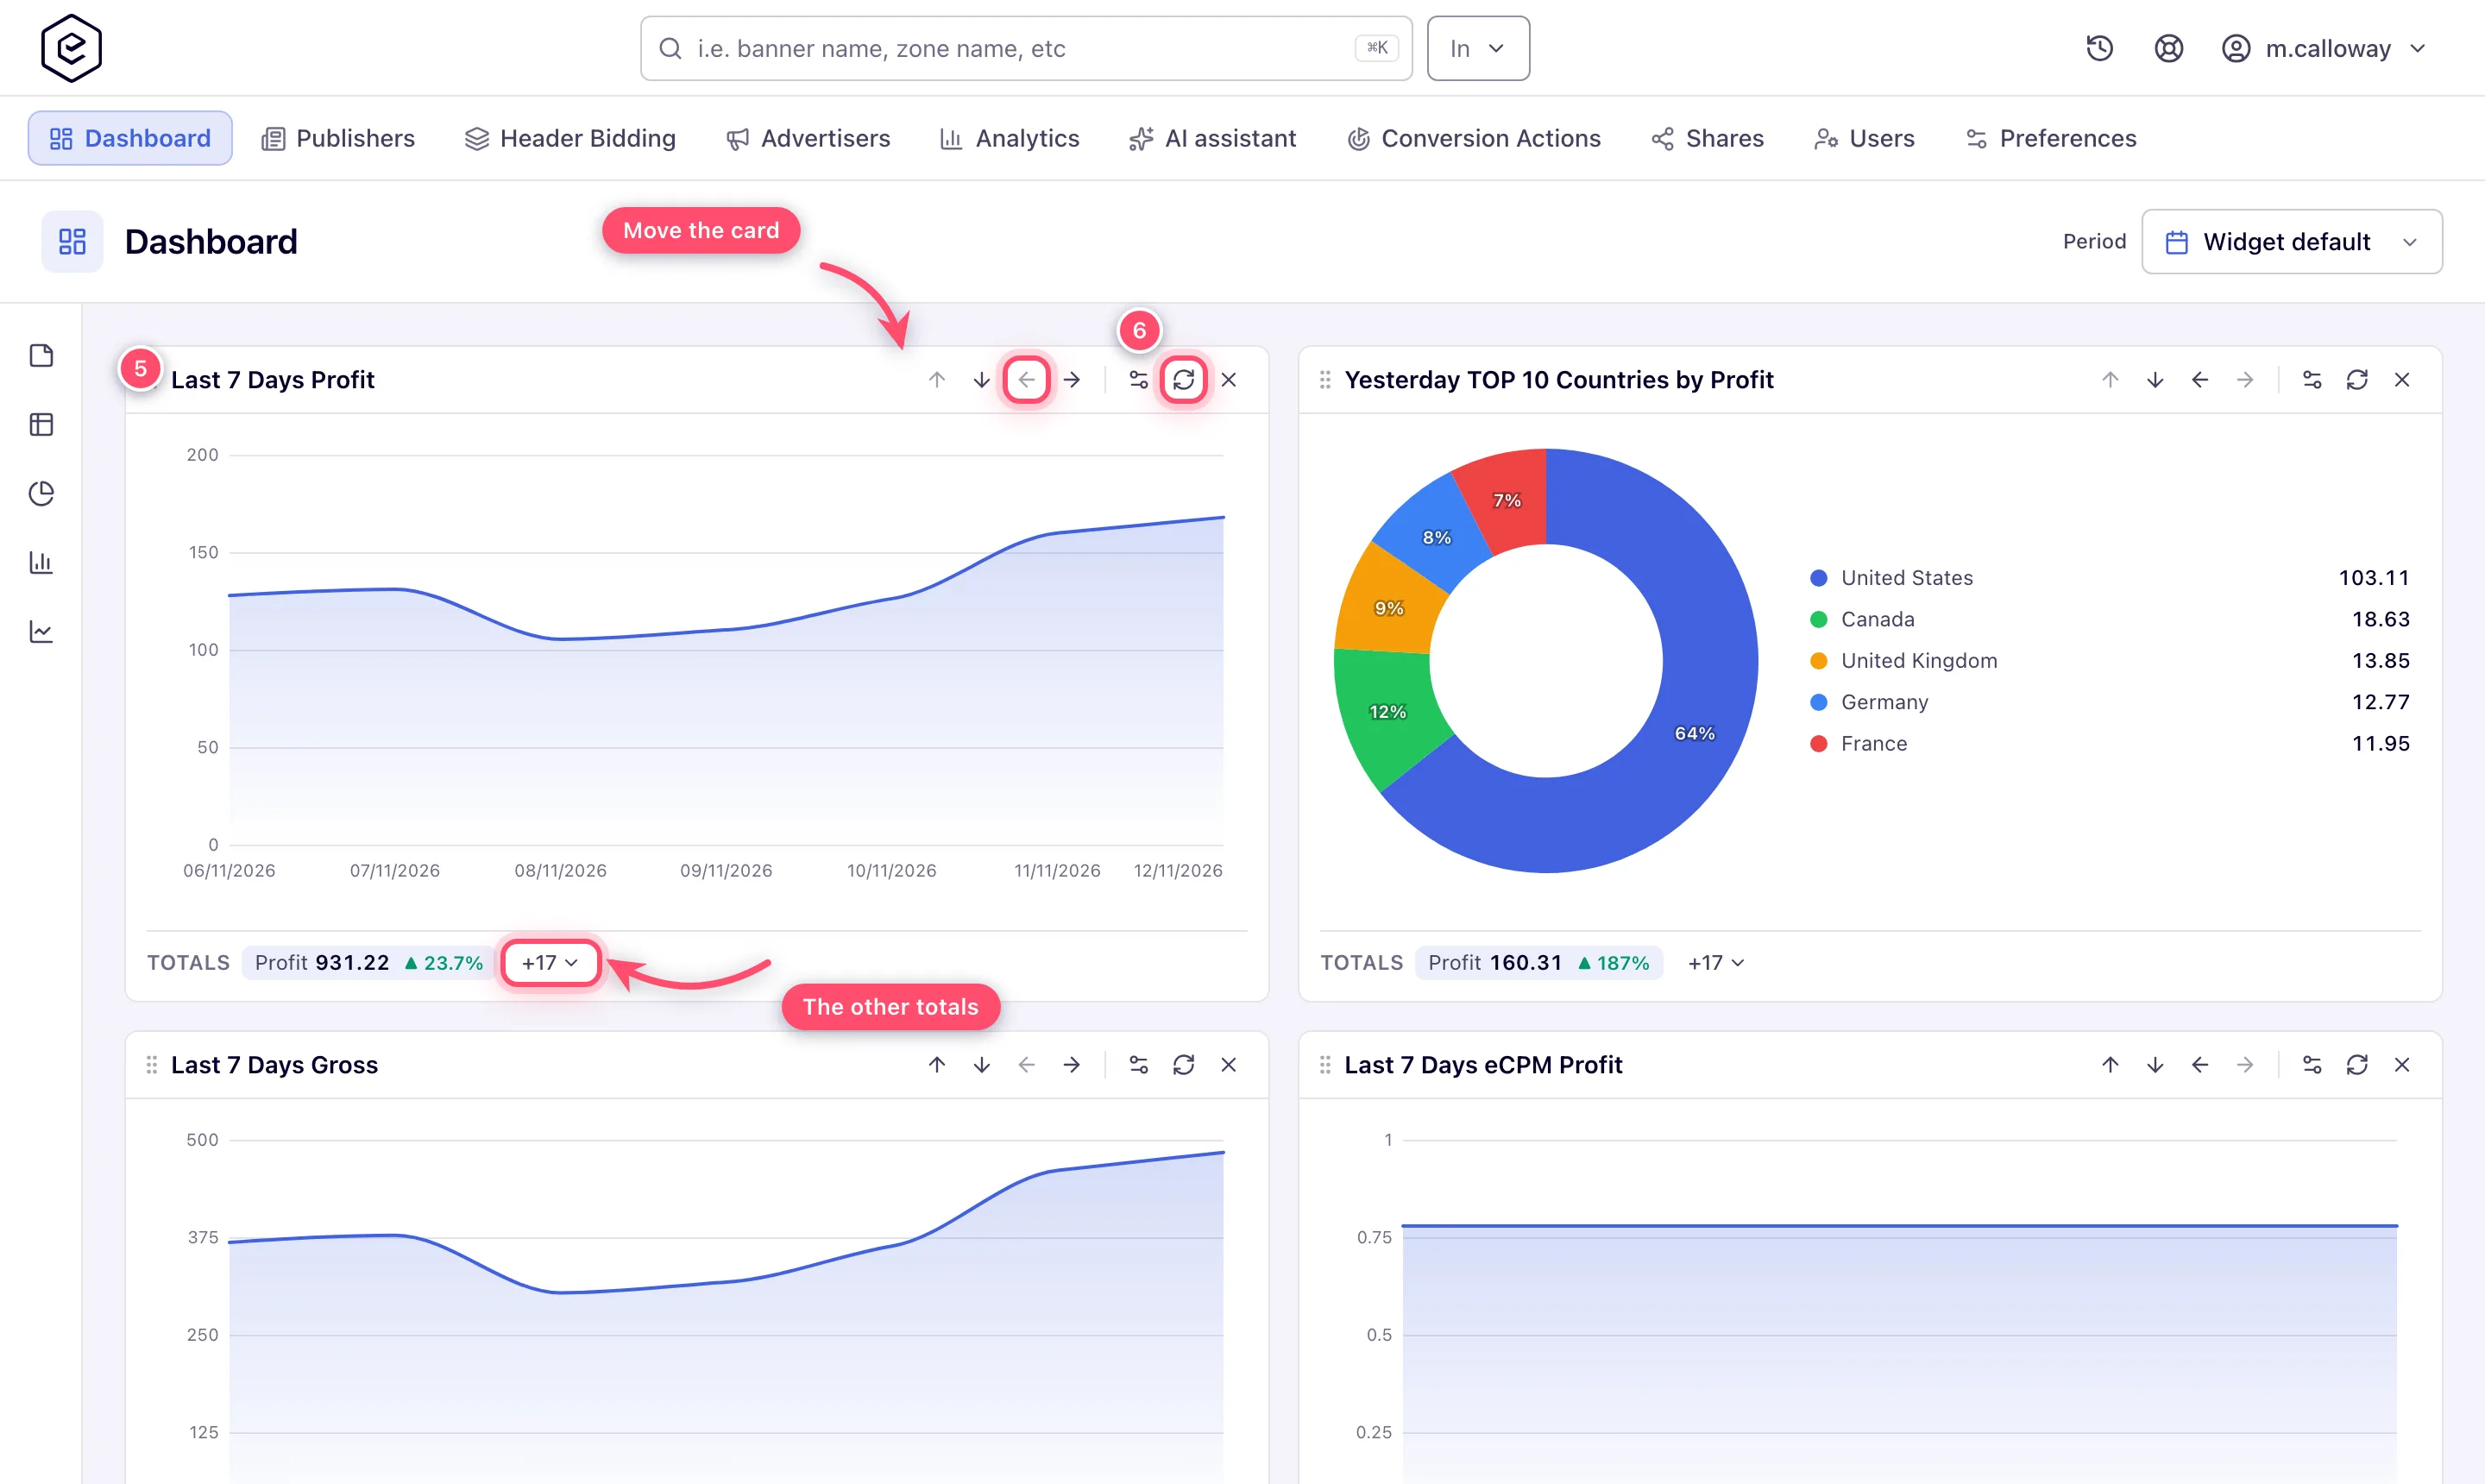
Rearrange by dragging a card by the grip at the left of its header, or with the four arrow buttons on the card: up and down move it within its column, left and right send it to the other one. The new order is saved immediately, and it is yours alone.
-
Use the card’s other header buttons: edit (opens the same dialog), refresh (re-asks the server for the widget’s data) and × (delete, after a Delete widget? confirmation).
-
Read the Totals strip below every analytics widget: a chip per metric with the widget’s grand total for its window, and an arrow next to each figure comparing it with the preceding window of the same length. The widget’s own metric leads; +N opens the full metric-by-perspective matrix (Base, and Publisher/Advertiser where those columns exist).
-
To look at every widget on one window, pick a range in Period in the page header. It offers the same fourteen ranges as the report builder, plus Widget default at the top of the list to hand each widget back its own saved range.
Add a widget straight from a report
On an executed report tab, open the Graph panel, choose the metric and click Add to dashboard; the dialog asks for a title, and the widget inherits the report’s range, grouping and filters. The widget type follows the chart’s shape: a report with a Group by and Time granularity None becomes a bar widget; a report broken down over time — with or without a Group by — becomes a line widget, with a line for each of the leading grouped entities when it is grouped. A report with neither a Group by nor a time breakdown draws no chart, so there is nothing to add. See Run a report.
Caveats and exceptions
Preset ranges move with the calendar. A preset is re-resolved every time the widget renders, so a Last 7 days widget always means the seven days ending today, never the seven days that were current when you configured it. Only Custom range pins actual dates. Today, Current week and the other ranges are days of the network’s time zone (UTC unless your network has been set to another zone), not of your browser’s, and a week starts on Monday.
“Select range” means Today. Leaving Range untouched saves the widget as Today. Pick Day for Breakdown by without touching Range and the save is refused with Must be Hour, which reads like a bug until you know Today is what is being enforced. Set the range explicitly. The full agreement table: Range and Breakdown by have to agree.
Group by and Breakdown by on a pie or bar are either/or. Setting one clears the other in the dialog, and sending both is refused with Must select ‘Group by’ or ‘Breakdown by’. On a table or line widget both may be set, but at least one must be, and the same message appears under both fields when neither is.
Entity filters are set once. The Publishers and Advertisers filter trees can only be set while creating a widget. The edit dialog hides them, and editing a widget does not disturb them. To change a widget’s entity scope, delete it and create it again.
Placement Size takes one size. Unlike the report’s filter, which takes several. To compare sizes against each other in a widget, leave the filter empty and group by Placement Size instead.
Stock titles are translated over yours. If you name a widget with one of the two dozen stock widget titles (Today By Sites, Last 7 Days Profit, Yesterday TOP 10 Countries by Profit and their siblings), the card shows the translated stock title instead of what you typed. In English the two are identical, so nothing looks wrong; in any other language your title is silently replaced. The edit dialog still shows what you typed. Vary the wording — Last 7 days profit (EU) — if you want the title you wrote.
Refresh does not force a fresh query. A widget’s rows and totals are cached on the server for 30 minutes, keyed on the widget’s configuration and window, and the refresh button does not bypass that — it just re-asks. A figure can be up to half an hour behind; the reliable way to get a new number sooner is to change the widget (any edit changes the key) or to move the global Period, which asks for a window the cache has not seen.
Two columns, never three. Widgets never spill into a third column, however many you add.
The caveats that apply to every dashboard — who lands where, no traffic, Period, the top-N chart cap — are on Dashboards.
Not working?
| Symptom | Cause | Where to check / fix |
|---|---|---|
| Must be Hour / Must be Day / Must be Month or Week under Breakdown by | Range and Breakdown by disagree; untouched Range = Today | set Range explicitly — the agreement table |
| Must select ‘Group by’ or ‘Breakdown by’ | Pie/bar with both set, or table/line with neither | the dialog’s Group by / Breakdown by |
| Submit is greyed out | Title is empty | the Title field |
| The card title is not what you typed | It matches a stock widget title and is shown translated | the edit dialog shows your text; vary the wording |
| Refresh does not change the number | 30-minute server cache per widget configuration and window | edit the widget or move Period |
| Period came back as Widget default after a reload | It is not saved | expected |
| The Publishers / Advertisers filters are gone from the edit dialog | They are only offered at creation | delete and re-create the widget |
| Browser / Operating System filters are missing | The report type’s group-by list has no such dimensions — General does not, Advanced does | the Type of reports field |
The rest of the list is on Dashboards.
Reference
Widget types, the dialog’s Options and fields and the Range and Breakdown by agreement table are on the hub.
