
Build the report form
The first half of running a report on Account → Analytics — pick the report type, the date range and the time granularity, then the Group by dimensions, the column split and the metric columns.
The Filter tab is where a report is composed: the type decides the data source and which controls appear, the date range and time granularity decide the window and the rows’ time buckets, and Group by, Split columns by and Columns settings decide what the rows and columns are. This page covers that half of the form; filters, entity trees and running the report follow on Filter, run and read the report, and the overview is on Run a report.
Example. A publisher manager wants last week’s revenue per site, one row per day: Type General, Date range Last 7 days, Time granularity Day, Group by Site, and the Revenue preset chip in Columns settings. Seven rows per site, Revenue and eCPM as columns.
Typical scenarios
| You want | Set | Where |
|---|---|---|
| One row per site per day for last week | Date range Last 7 days, Time granularity Day, Group by Site | the Filter form |
| An hour-of-day profile of today’s traffic | Time granularity 24 Hours (needs the hourly permission) | Time granularity |
| Conversions per action as separate columns | Split columns by Conversion action, 1–25 actions | Split columns by |
| Only the payout columns, with entity IDs | Publisher payout chip, Show IDs | Columns settings |
Step by step
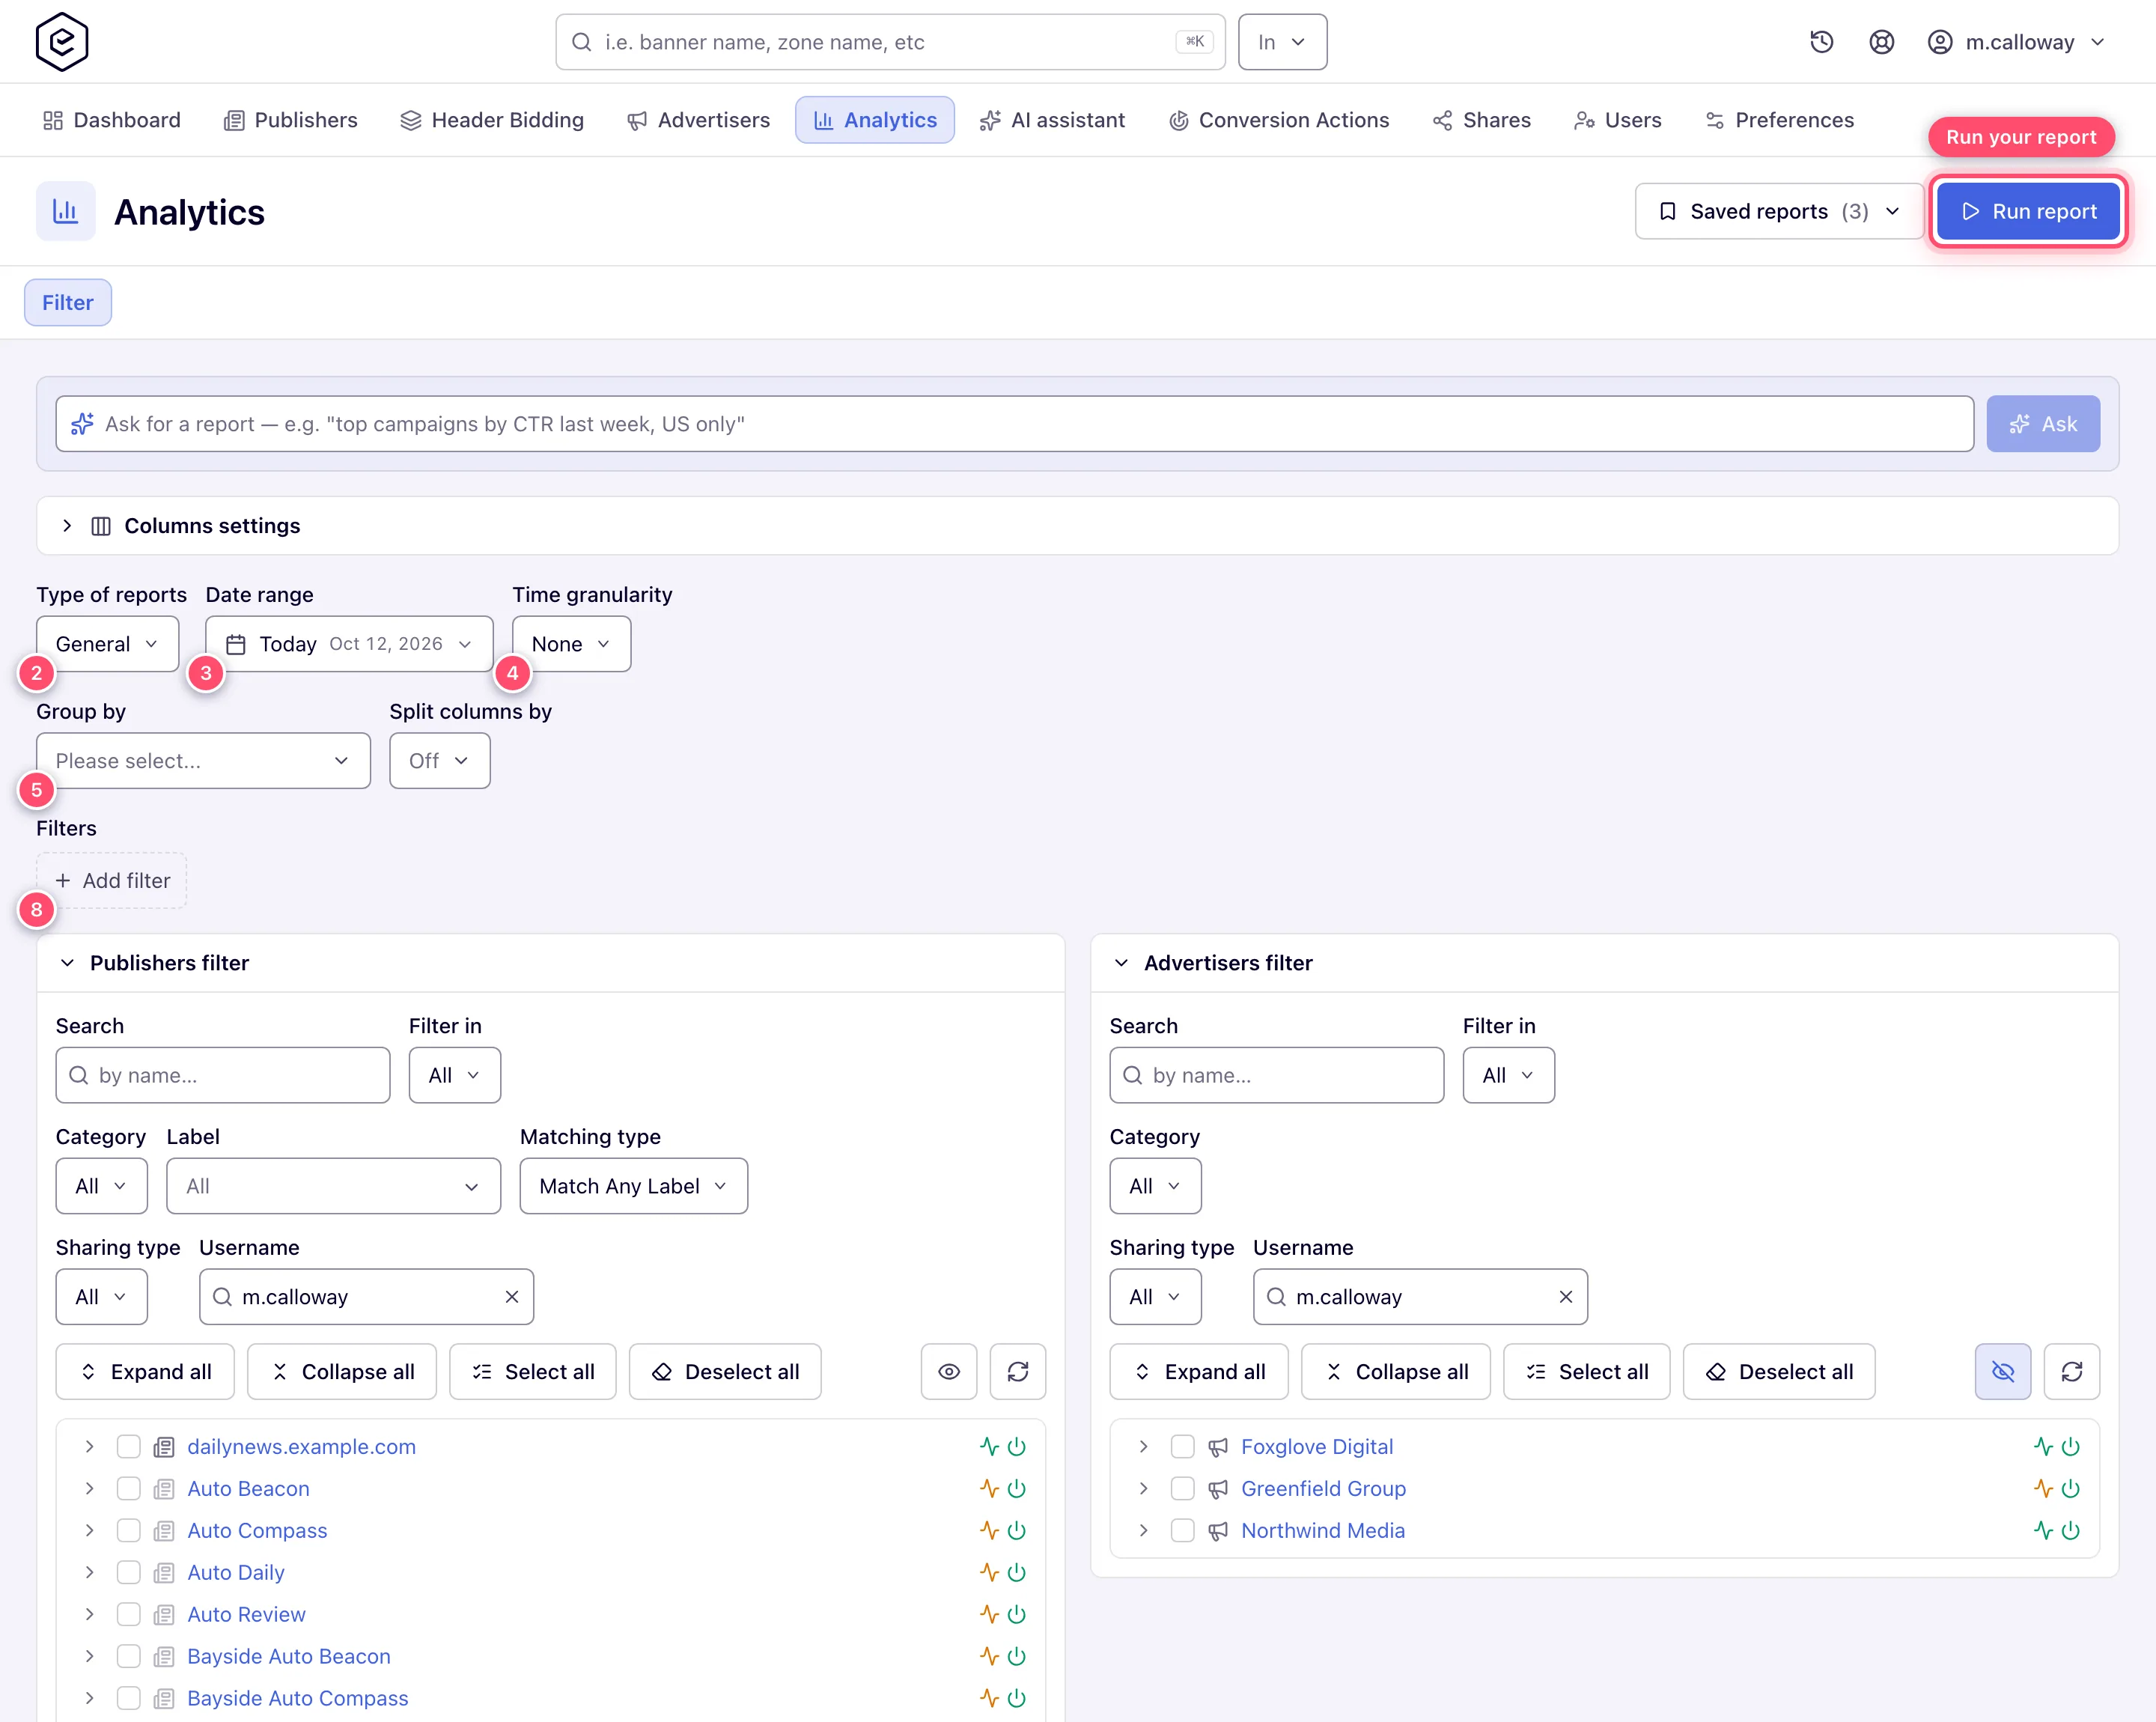
Type, dates and granularity
- Go to Account → Analytics. You land on the Filter tab.
- Pick the Type of reports. General is the default aggregate report and the one that needs no extra configuration; each of the others depends on its own data store or network flag and changes which controls appear at all — see Report types. Changing the type resets the rest of the form: only your date range and your Valid/invalid choice survive.
- Pick the Date range — a calendar popover with the preset list down its side (Today … Last year, and Custom range: click two dates in the two-month calendar). A preset stays relative: a saved “Last 7 days” still means the last seven days next month. Details: Date range.
- Set the Time granularity — None (the default) collapses the whole window into one figure per row; Day gives one row per day; Hour, Week, Month, Year and 24 Hours (an hour-of-day profile) likewise. Which steps you can pick depends on the report type and your permissions: Time granularity.
Group by, split and columns
-
Choose Group by — the dimensions that become the rows. The order you tick them in is the order their columns appear in — Site then Placement reads as a drill-down, the other way round does not. There is no Date among the dimensions: bucketing by time is Time granularity, and the two combine — Group by Country with granularity Day gives one row per country per day.
-
Optionally choose Split columns by — what runs across the columns: a saved funnel, one column per Conversion action (or the VAST quartiles / Viewability / Video player interactions families), Attribution type, Expired windows, or Custom parameter. Every split divides conversions, so picking one ticks the column it needs for you. Details: Split columns by.
-
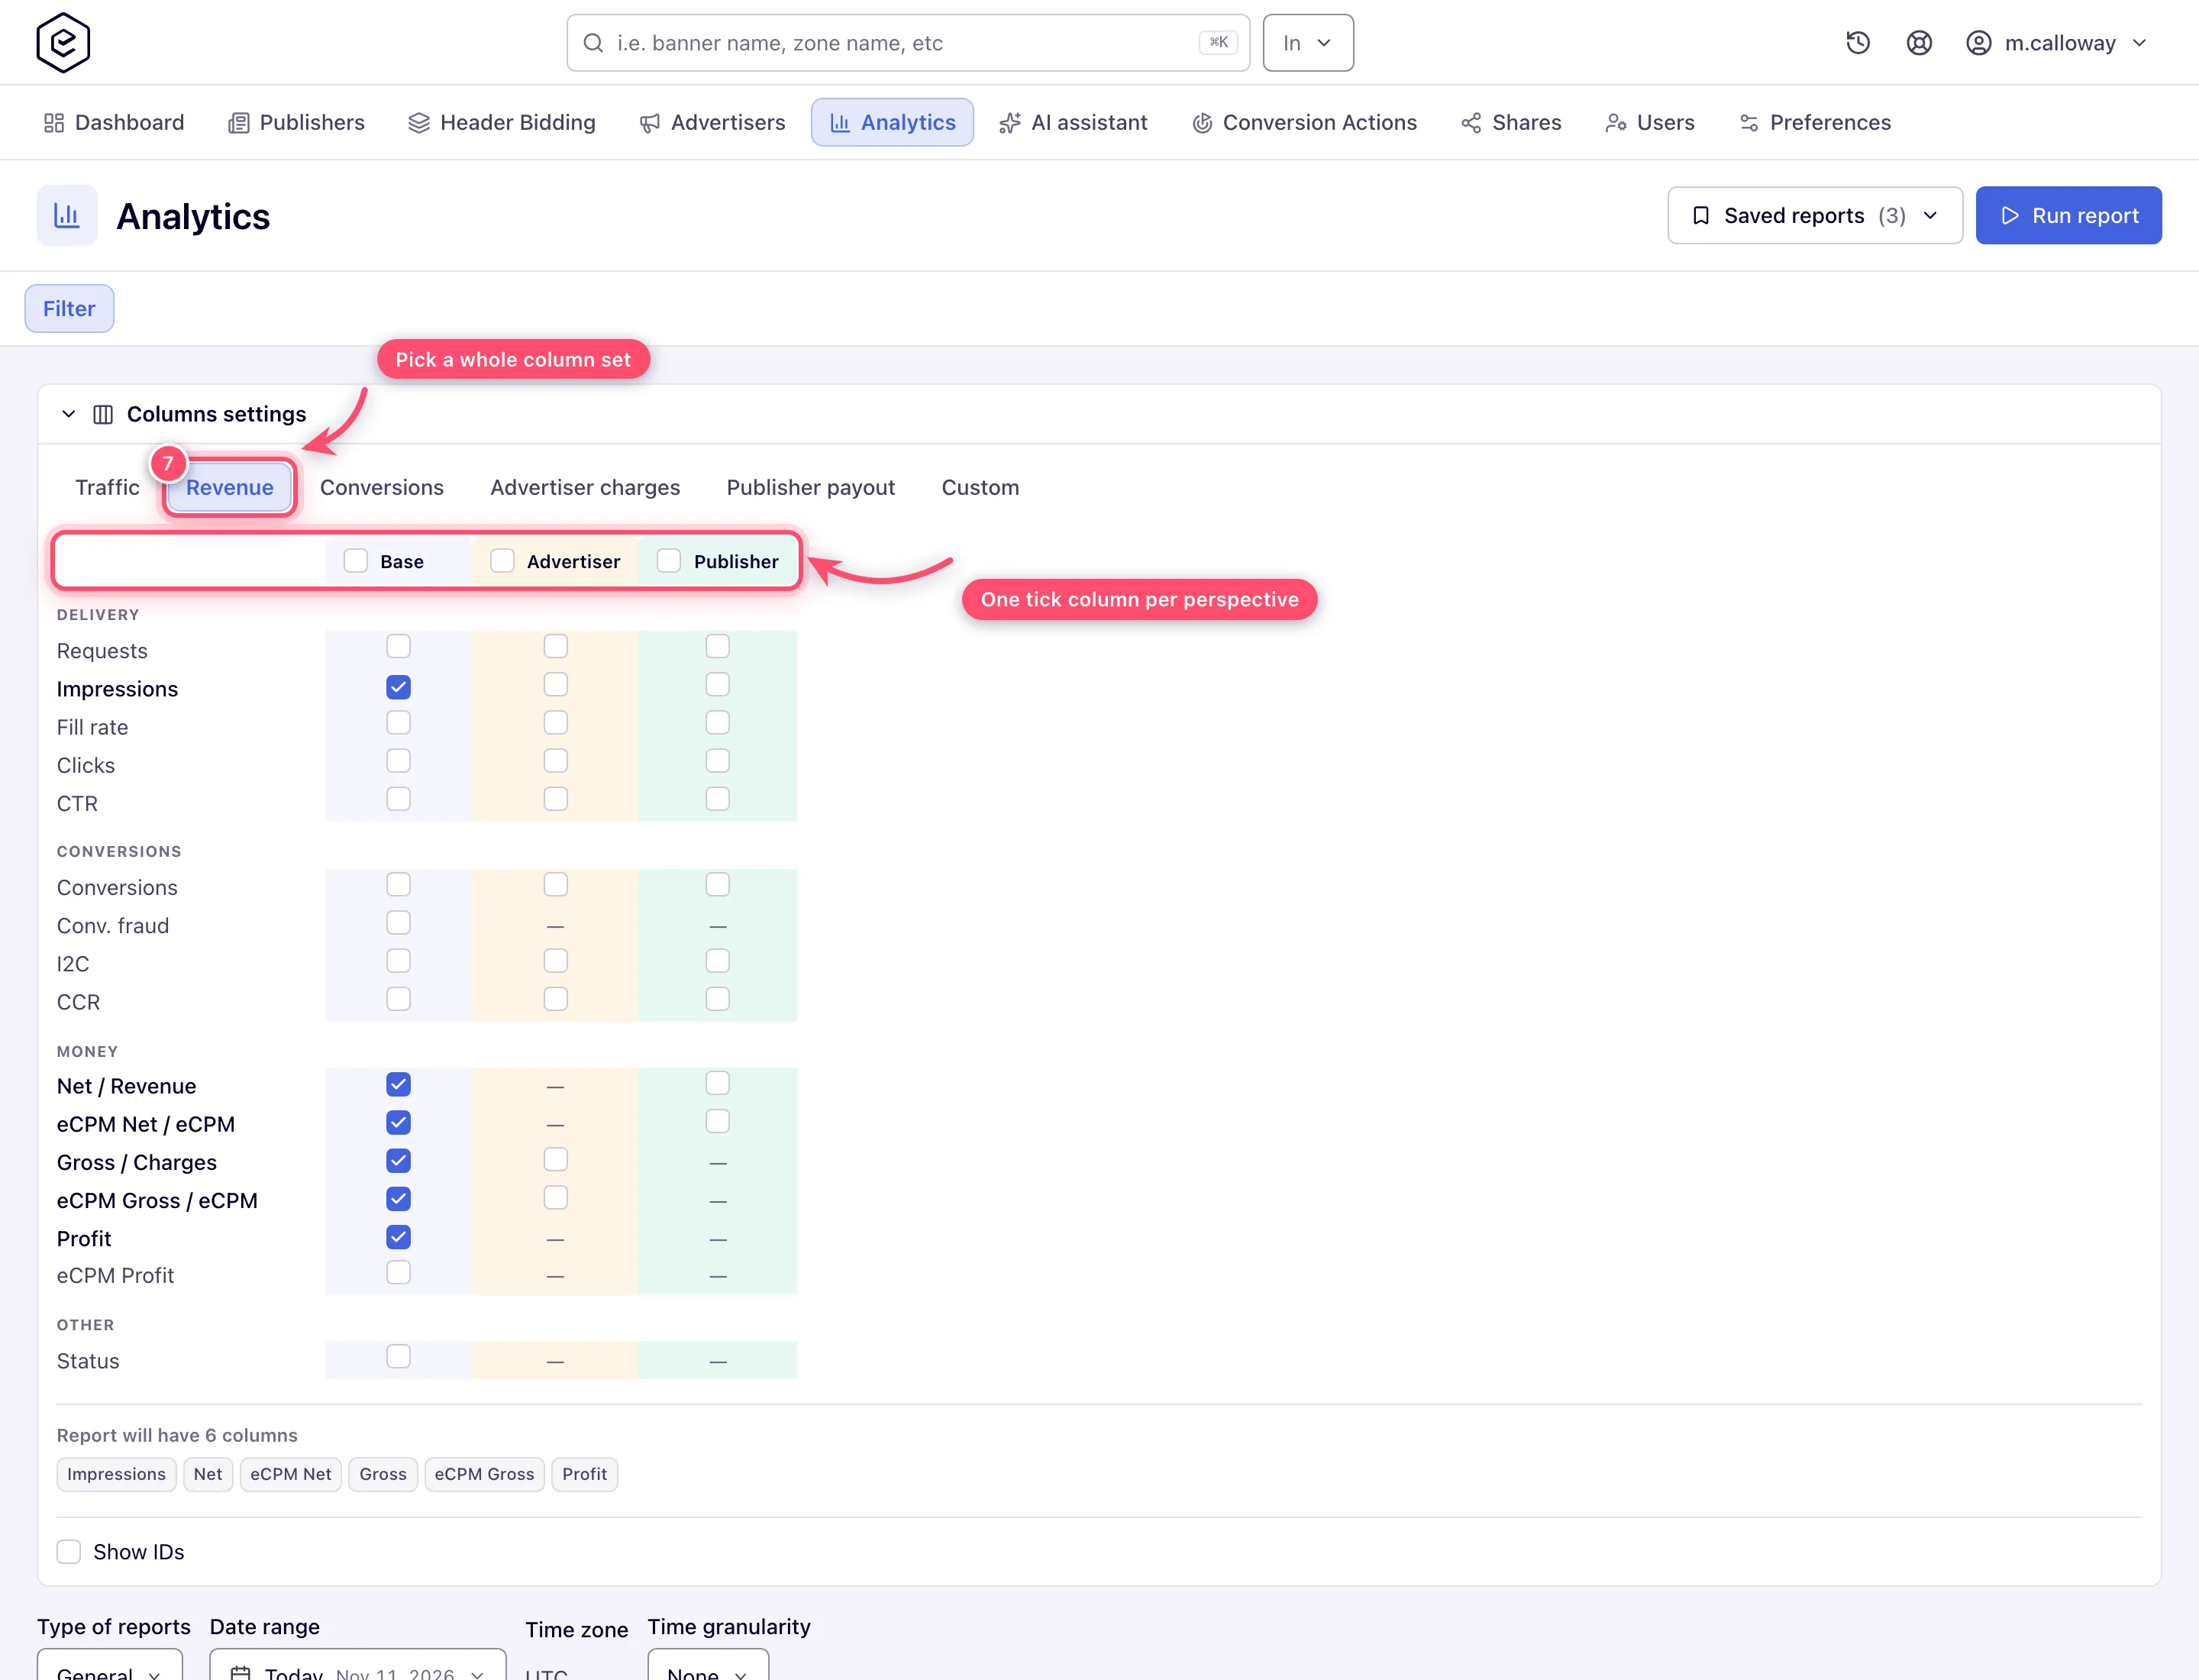
Tick the metric columns in Columns settings at the top of the form — a matrix of metrics × perspectives (Base, Advertiser, Publisher). Preset chips (Traffic, Revenue, Conversions, Advertiser charges, Publisher payout) pick a whole set; Show IDs adds the entity-ID columns; a line under the matrix reads “Report will have N columns”. At least one metric must stay ticked. Details: Columns settings.
Caveats and exceptions
The default form returns one row. With Group by empty and Time granularity None there is nothing to break rows on, so the report returns exactly one row — the totals for the whole window — and offers no graph. Add a Group by, a granularity, or both.
Presets follow the network’s calendar. In a General report the presets use the network’s time zone (UTC unless your network has been set to another zone), weeks starting on Monday; an Advanced report reads them in its own Time zone. Last 7 days and Last 30 days include today in both.
Hour and 24 Hours read the hourly aggregates, while every other granularity reads the daily ones. If the hourly data is behind, switching granularity can change the totals or empty the report on a network where the daily one is fine.
The Conversion action split has limits. It refuses to run with zero or more than 25 actions selected — “Please select up to 25 conversion actions for the breakdown”. Past 20 columns (actions × attribution arms) the form warns; past 40 it refuses and suggests moving attribution into Group by. The VAST quartile / viewability / interaction presets pick their own actions, so they never trip the first rule.
Grouping by Attribution type blanks the delivery metrics rather than repeating them on every row: one ad-log row is spread across the attribution types present, so summing them would multiply each figure by the number of rows. The figures stay available in the un-split report and in the column split.
Removing Action from Group by silently clears the action-custom-parameter split and its filter values — they only mean anything with an Action grouping.
A report with no columns shows nothing. A report run without a single column from Columns settings shows “This report has no columns to show” in place of the tiles and the grid — also when it is grouped or broken down by time. The form itself never sends such a report (it says “Choose at least one column in Columns settings, then run the report.”), so this only meets one started some other way. Event logs are the exception: their columns are the fields of each event.
The caveats that apply to the whole report — who can do this, the type reset, time zones, the running-report cap, session tabs — are on Run a report.
Not working?
| Symptom | Cause | Where to check / fix |
|---|---|---|
| One row, no graph | No Group by and granularity None | add a Group by or a granularity |
| A date range is greyed out with a padlock | Your role lacks that Analytics Report Time Range … permission | User roles |
| 24 Hours (or another step) is missing | Role lacks Analytics Report Breakdown By …, or the type does not offer it | the administrator; Time granularity |
| ”Choose at least one column in Columns settings, then run the report.” | Empty column matrix (an empty saved set opens with every column ticked) | tick a column |
| ”This report has no columns to show” | A report started outside the form with no columns | tick a column and run again |
| Totals changed when I switched to Hour | Hour / 24 Hours read the hourly aggregates, which can lag | compare on Day; wait |
| ”Please select up to 25 conversion actions for the breakdown” | 0 or > 25 actions in the Conversion action split | pick 1–25 |
| The split refuses past 40 columns | actions × attribution arms > 40 | move attribution into Group by |
| Delivery columns are blank | Grouped by Attribution type | read them in the un-split report |
| The custom-parameter split vanished | Action left the Group by | add Action back |
| The hour around the DST switch looks doubled / missing | Clocks went back / forward on a non-UTC network | expected |
The rest of the list is on Run a report.
Reference
The essentials are in Options and fields; every control in full on Run a report reference: Date range · Time granularity · Group by · Split columns by · Columns settings.
